Reports
In accordance with our Lifecycle policy, the Windows GUI is no longer supported from Thinkwise Platform version 2026.1 and higher. This means some features on this page are no longer supported. See Transition to the Universal UI for more information.
Introduction to reports
A report is a feature that allows you to generate and present data in various formats, such as printed documents, previews or exports. A report can be created with a reporting tool, such as DevExpress Reports, Crystal Reports, i-net Clear Reports, SQL Server Reporting Services (SSRS), or Word.
The structure of reports is similar to that of tasks, where parameters are defined for a report, and references provide lookup functionality.
- Thinkwise Academy - How to build a Report using DevExpress (Specialist)
- Thinkwise Academy - Custom Features in DevExpress Reports (Expert)
 Reports overview
Go to related screens
This screen contains tasks that take you to the Code overview, Model rights, and Menu screens for the selected report. For more information on this generic feature, see Go to a related screen for an object.
Third-party integrations for reports
In addition to the integrated options mentioned in this manual, it is possible to connect to external tools for document generation.
For example:
- PandaDoc - Offers a document generation API that can be used to create documents programmatically. This can be a good option if your organization needs to generate large volumes of documents.
Reporting requirements
The Thinkwise Platform supports various reporting solutions for creating integrated reports. Some of these solutions require additional report designer licenses and runtime components to be installed.
Please be aware that there may be license fees involved.
| Reporting solution | Designer license | Requires runtime |
|---|---|---|
| DevExpress | Provided by Thinkwise | No |
| Crystal Reports | Paid | Yes |
| Microsoft Word | Word | Yes (Word) |
| Aia Software ITP | Paid | Yes |
| I-net Clear Reports | Depends | Yes |
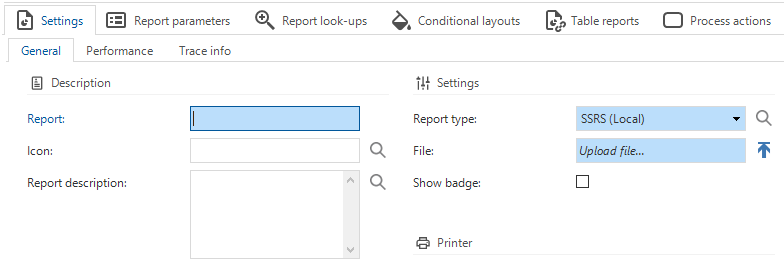
Create a report
To create a report:
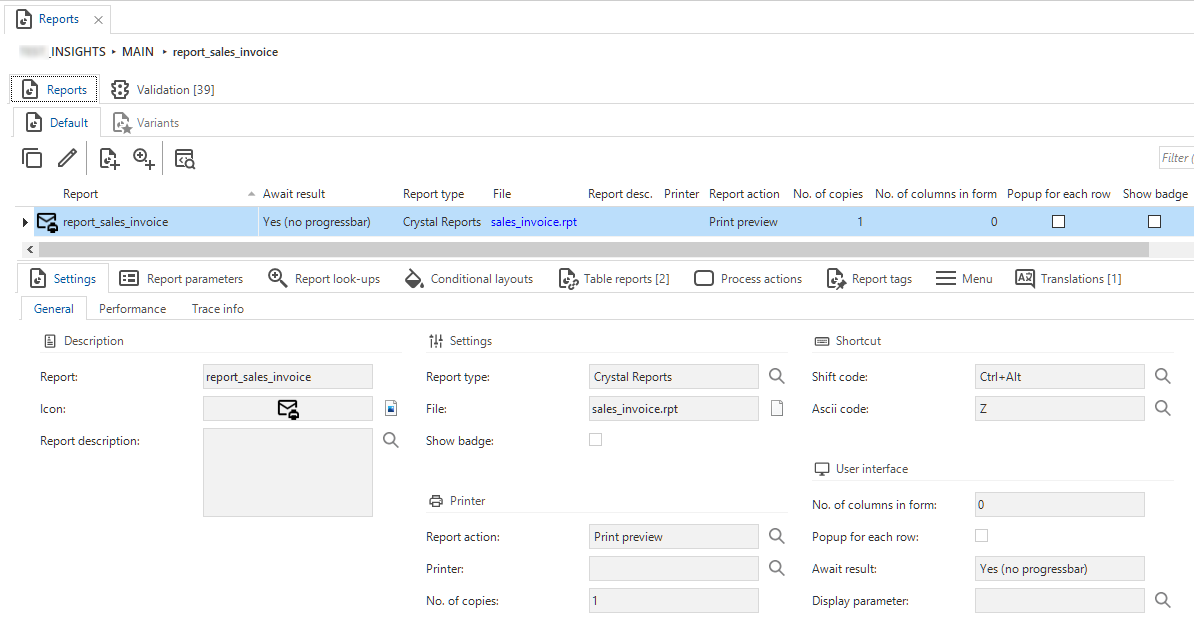
menu Processes > Reports > tab Settings > tab General
- Enter a Report name.
- Select a Report type. See Report types.
- Select a File to open a different or user-specified report. In IAM, this file can be overridden by another file to create a custom report for an application, see Custom report for an application.
- Add a Report action. See Report actions.
- Enter No. of copies.
- To ensure the report can be generated by the intended roles, assign rights to a role or role groups. For more information, see Assign rights to a role.
- Universal UI Enter a Form column width factor. This factor determines the relative width of the columns in a form. For more information, see Form column width factor.
- Select an Await result option. See Await result.
- Optional. Create an alternative translation for the Confirm and Cancel buttons. See Alternative translation for report buttons.
![]() Changing the translation of the 'Confirm' and 'Cancel' buttons
Changing the translation of the 'Confirm' and 'Cancel' buttons
Create a subreport
DevExpress Universal GUI Windows GUI (3-tier)Only for DevExpress reports, you can create subreports. A report can have multiple subreports. For more information, see the DevExpress documentation.
To create a subreport:
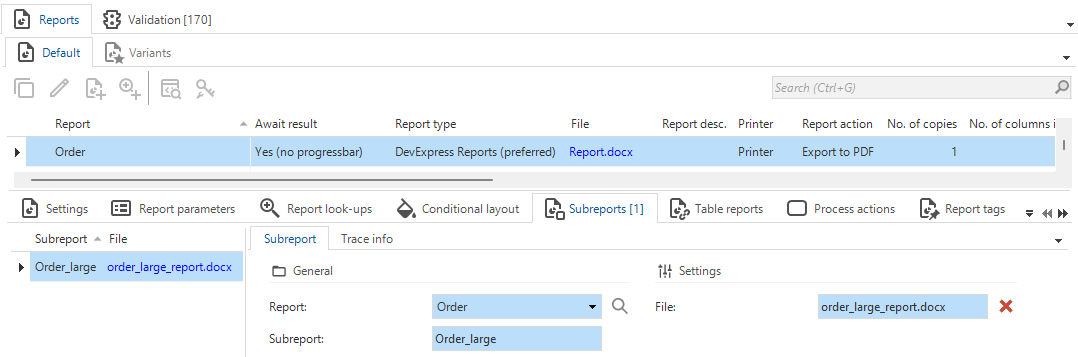
menu Processes > Reports > tab Subreports
- Select the DevExpress Report for which you want to create a subreport.
- Enter the Subreport name. The name of the subreport in the DevExpress Report Designer must match the name you enter here, to ensure the subreport is correctly referenced.
- Upload the File.
 A subreport for DevExpress reports
Alternative translation for report buttons
Changing a button's translation can be useful for context-specific actions, to clarify the action being performed. You could, for example, change the translations from 'Confirm' to 'Accept', and from 'Cancel' to 'Decline'
To create an alternative translation for a Confirm or Cancel button in a report:
menu Processes > Reports > tab Default > tab Settings > group User interface
-
Add a translation label:
- For the 'Confirm' button: select the checkbox Confirm button alt. transl. and enter a translation Label.
- For the 'Cancel' button: select the checkbox Cancel button alt. transl. and enter a translation Label.
-
Go to the tab Confirm/Cancel button alternative translations.
-
Enter the alternative translation.
See also Alternative translations for report variant buttons.
Report parameters
Set up report parameters
After creating a report, you can add parameters that define the input values. Parameters are arranged in a specific sequence and linked to a domain for the data type and the control.
menu Processes > Reports > tab Report parameters
- Select the Report for which you want to create a parameter.
- Enter a Report parameter name. If a report parameter has the same name as the column, the column translation and form translation are automatically copied to the report parameter. For more information, see Translations.
- Optional. Create an alternative translation for the report parameter. See Alternative translation for a report parameter.
- Enter the model settings:
menu Processes > Reports > tab Report > tab Default/Variants > tab Report parameters > tab Form > tab Report parameter
- In the group Model settings, enter the model settings:
- Domain
- Mandatory
- Property - See Link parameters to properties
- Case type
- Default value type - See Default value for a report parameter.
- In the group Form, format the report parameters:
Link properties to report parameters
You can enhance reports by linking properties (for example, Action, File specification, or Printer) to report parameters. This allows you to use these properties in defaults and layouts, and place them in the correct location within the right group.
To link a property to a report parameter:
menu Processes > Reports > tab Reports > tab Default/Variant > tab Report parameters
- In reports without property parameters, all properties are shown at the top of the parameter dialog.
- For each property parameter modeled in the Software Factory, the default parameter at the top of the dialog is removed and added as a regular parameter in the form. This enables the parameter to be manipulated with a default and/or layout procedure, and a default value can be set for the parameter.
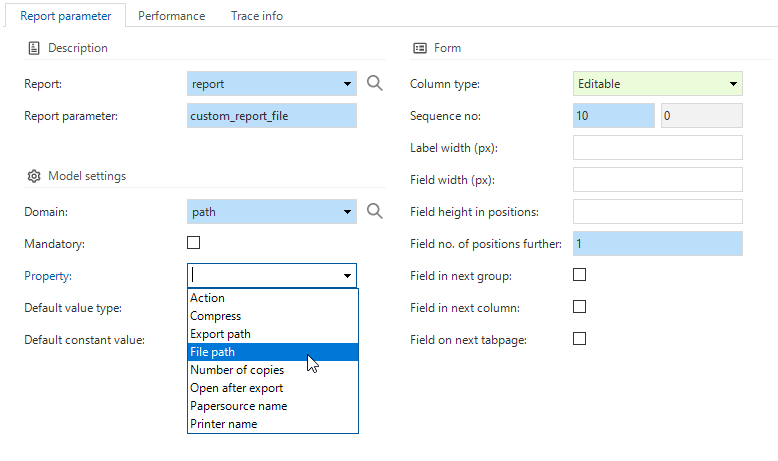
- Select a Report.
- Add a Report parameter.
- Select a Domain.
- Select whether the parameter is Mandatory.
- Select the Property. You can select from the following properties for the Windows GUI. Universal GUI Only the properties Action and Export path are supported.
| Property | Description | Datatype |
|---|---|---|
| Action | The default action for the report, such as print preview or export to PDF, is determined by the value specified in the model. For an overview of possible values, see Report actions. Universal GUI With this property the user interface creates a dropdown editor that shows the available output format options. Users can select the desired output format, such as Excel, Image, Word, HTML, etc. The default format is a PDF preview. | Integer |
| Compress | Indicates whether the exported file has to be compressed or not. | Boolean |
| Export path | Use this to specify the location and name where the exported file is saved. | String |
| Number of copies | The number of copies to be printed. | Integer |
| Open after export | Indicates whether the file has to be opened after export. | Boolean |
| Papersource name | The paper source name to use. | String |
| Printer name | The printer to use. | String |
| Report file | Use this to create custom reports, for example, for large orders or small orders. Select a file to open a different or user-specified report. You can store report files in your storage location and supply them in a report parameter with the required data using a default procedure. You need a storage location and also the domain of the property needs to have a storage location. In IAM, this file can be overridden by another file to create a custom report for an application. See Custom report for an application. | String |
 Linking a parameter to a report property
Default value for a report parameter
menu Processes > Reports > tab Default/Variants > tab Report parameters
In the field Default value type, you can select a Constant value or an Expression:
- Default constant value - A fixed value that is filled when adding a record. With a change, this value is not filled.
- Query - The expression used to determine the default value. The query cannot use values from the other report parameters.
For the following functions, the Software Factory will not generate a function but instead use the given Query as the default value.
To use these functions as a default value query, you should specify them without select.
- newid()
- getdate()
- getutcdate()
- sysdatetime()
- dbo.tsf_user()
- dbo.tsf_original_login()
Alternative translation for a report parameter
Alternative translations can be created for a report parameter in a form or tooltip. This translation is used in the user interface instead of the default translation.
To create an alternative translation for a report parameter:
menu Processes > Reports > tab Default > tab Report parameters
- Select the checkbox Alternative translations.
- Enter an alternative translation Label.
- Save the settings.
- Go to the tab Alternative translations.
- Add an alternative translation.
See also Alternative translation for a report variant parameter.
Report actions
menu Processes > Reports > tab Settings
The table below lists the available actions and their corresponding value. Note that not all actions are available for all report types. More information on the different export formats for Crystal Reports can be found here.
| Action | Value |
|---|---|
| Print preview | 1 |
| 2 | |
| Export to PDF | 3 |
| Export to RTF | 4 |
| Export to XML | 5 |
| Export to CSV | 6 |
| Export to Excel | 12 |
| Export to Word | 13 |
| Export to TIFF | 14 |
| Export to HTML | 15 |
| Export to PNG | 16 |
| Export to Excel - data only | 9 |
| Export to Excel 2003 | 7 |
| Export to Excel 2003 - data only | 8 |
| Export to Word 2003 | 10 |
| Export to Word 2003 - editable RTF | 11 |
Report lookups
A lookup allows users to select or view a value from a field in an associated table. For each field, you can configure whether a lookup should be displayed, what reference the lookup should use, and how users select a value. You can set up the default settings for a table in Default lookup display settings.
Configure a report lookup
To configure a report lookup:
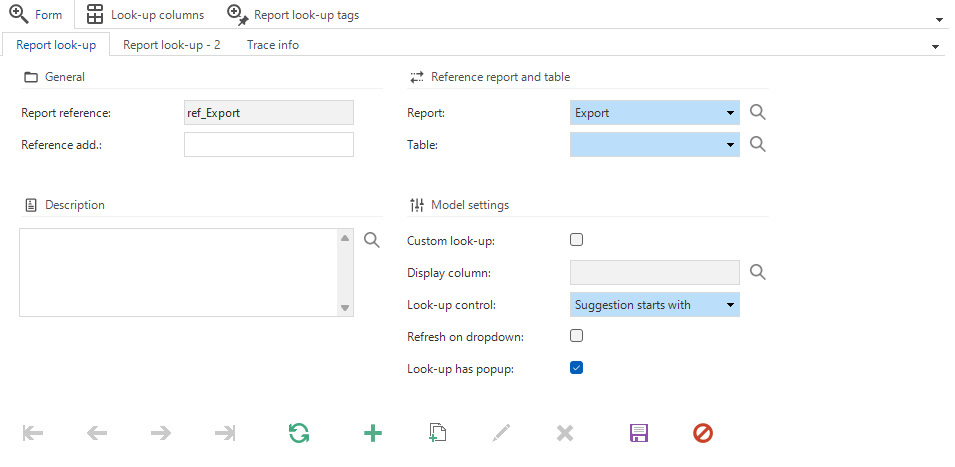
menu Processes > Reports > tab Reports > tab Default > tab Report look-ups
-
Select a Look-up control to configure how the lookup is displayed for the user. The following options are available:
- Auto complete - when typing, the first record that matches the input of the user is displayed automatically.
- Combo (alphabetical) - a value from a combo box can be selected. The list is sorted alphabetically.
- Combo (sorted) - a value from a combo box can be selected. The list is sorted according to the default sorting of the look-up subject.
- Suggestions (contains) - When typing, values containing the input are presented. On a mobile device, a keyboard opens.
- Suggestions (starts with) - When typing, values starting with the input are presented. On a mobile device, a keyboard opens.
When a new table is created, the default lookup control is set to Suggestions (starts with), since this ensures better performance when returning a large number of rows from a lookup table.
tipFor tables with a small dataset, a Combo lookup control may be suitable, since it displays all available values from a lookup table in a drop-down list. For tables with larger datasets, other options like Suggestions (contains) may be more suitable, since this lookup control allows users to search for a value.
-
Optional. You can create a custom look-up by selecting the checkbox Custom look-up. You can use this setting to override the default lookup control and lookup display column.
You can select an alternative Display column, which determines what field is shown to the user when they use the lookup. For example, the default settings for a display column could be to display the customer_name. By using a custom display column, you can set the lookup to display customer_fullname instead.
To configure the settings for the Display column, select the lookup control
 and go to tab Form.
The following settings are available:
and go to tab Form.
The following settings are available: -
Optional. Select the checkbox Look-up has popup to display the look-up table in a pop-up window.
- Optional. Select the checkbox Refresh on dropdown to refresh the lookup data before the combo box expands.
- Optional. Select a Look-up table variant to display a variant of the lookup table.
After you have created the lookup, you must create a report lookup column to display the relevant information from the table you have referenced.
- You can use the task Create reference
 to create a reference and set up the lookup columns immediately.
The reference automatically adopts the lookup control defined for the target table.
to create a reference and set up the lookup columns immediately.
The reference automatically adopts the lookup control defined for the target table. - You can filter what is shown in a lookup by using prefilters to the lookup table. You can achieve this by setting the Look-up state to On, On hidden or On locked. A prefilter is then applied when the lookup is opened, and depending on the Look-up state, it can be modified by the user.
 Lookup settings for a report
Create a report lookup column
A lookup column defines which data from a referenced table is retrieved and displayed in the lookup. Before you can create a lookup column, you must create a report lookup.
To create a lookup column:
menu Processes > Reports > tab Reports > tab Default > tab Look-up columns
- Select a Report parameter.
- If a Column with the same name as the report parameter exists, it will automatically be filled. Otherwise, you must select it manually.
- Optional. Add a Sequence no to change the order of the columns.
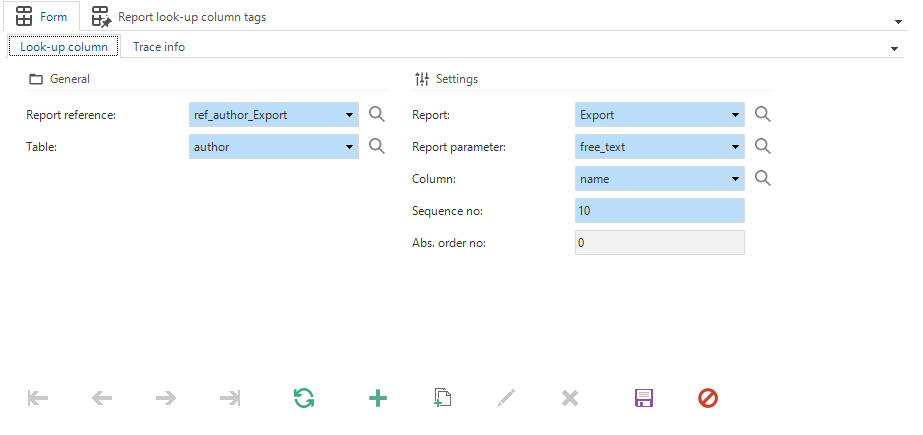 Lookup column settings for a report
Copy a report
To make a copy of a report:
menu Processes > Reports > tab Settings
-
Execute the Copy report
 task.
task. -
Enter a name for the copy in the field To report.
-
Select what you want to include in the copy:
- Table reports - Include the links to one or more tables. See Table reports.
- Functionality assignments - Include the functionality assignments. If you deselect this option, the copied report will not be assigned to any control procedure. Use this to create a bare object (the copied report). Then, create a new control procedure, and assign the copied report to it.
 Copy a report
Add conditional layout for a report
menu Processes > Reports > tab Conditional layout
Just as with columns, you can give report parameters a background color or a different font. You can use this to draw the user's attention to a specific report parameter. Since a report does not have a grid, this will only be applied to form parameters.
For more information, see Conditional layout.
Table reports
Create a table report
A table report is a report that is linked to one or more tables. In these tables, the report is displayed in the ribbon, the context menu, or the report bar, or as a report tile.
menu Processes > Reports > tab Default/Variants > tab Table reports > tab Table report > tab Form
-
Select the Table and Report.
-
Optional. Select a Report variant. See Create a report variant.
-
If necessary, change the Sequence no to determine the order of the reports in the report bar.
-
Optional. Select the Report group from the drop-down list. See Create a report group.
-
To make the report available in the table, select the checkbox Available.
-
By default, a report is available when a screen contains no records. To disable the report in that case, clear the checkbox Enable for empty subject.
noteThe default for field Enable for empty subject is set in the menu Models > Model overview > tab Branches > tab Form.
-
To control the performance, configure the Refresh after execute behavior:
- None - the user interface will not refresh any data.
- Row - the user interface will only refresh the current row.
- Subject - the user interface will refresh the current subject, including lookups and details.
- Document - the user interface will refresh the main subject, including all lookups and details.
-
Optional. To show a table report in a Report bar or a (Custom) action bar, select the same Screen area as the bar. For more information, see Screen areas.
-
Optional. Select the Custom display type:
-
Universal GUI - If there is enough space, the report is presented according to the selected type. If not, the report will be shown in the overflow menu. If left empty, the custom display type of the Custom action bar is used, or else the custom display type of the Action bar.
For example, Icon + text (> text > icon) means that the report is displayed as an icon with text. On a smaller screen with less space, it is displayed as text (the first fallback: > text). With even less space, it is displayed only as an icon (the second fallback: > icon). The overflow menu is always the last fallback type, except for the display type Hidden.
-
Windows GUI - The following options are supported:
- Hidden - The report is not shown but can be started with a keyboard shortcut, a double-click task, or a process flow.
- Overflow - The report is not shown in the report bar but is shown in the ribbon menu and context menu.
- In all other cases, the report is shown in the report bar, the ribbon menu, and the context menu. On a smaller screen with less space, it is moved to the overflow menu.
-
-
After linking a report to a table, connect the table columns to report parameters on the tab Table report parameters. The active record's field value is passed on to the parameter as a default value.
-
Universal GUI Optional. Select Primary action to highlight the report on the screen. This can help establish a clear visual hierarchy in your application by directing the user's attention to specific and important actions.
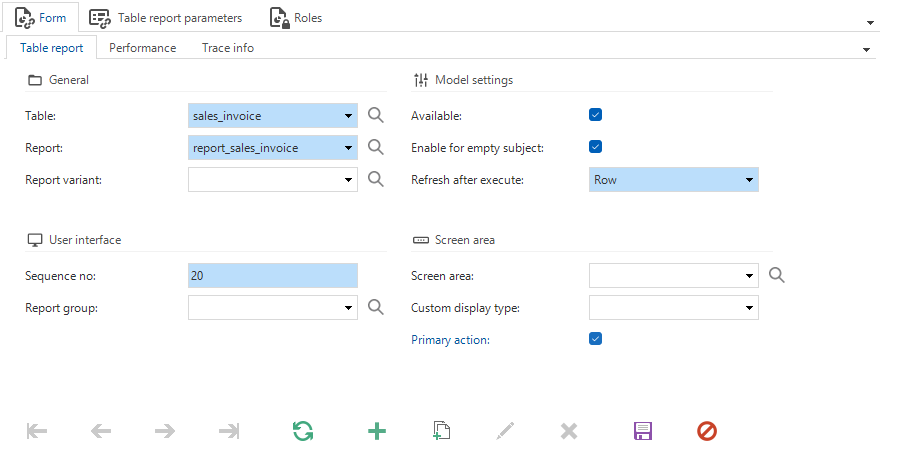 Settings for a table report
Create a report group
Table reports can be grouped together in a report group. This allows you to organize related reports under a common button, making it easier for users to find and use them.
To create a report group:
menu Processes > Reports > tab Default/Variants > tab Table reports > tab Report groups
- Create a new Report group and add a Description. The Sequence no. is automatically assigned, but you can change it to determine the order in which the report group appears.
- Optional. Add an Icon to represent the report group.
- Optional. Select the checkbox Submenu to display the reports in a report group as a submenu. If this option is not selected, the reports are grouped visually with separators.
- Optional. Select a Custom display type. This allows you to display grouped tasks differently for each screen. This option becomes available when you select Submenu.
When you create or edit a report, you can now add it to the Report group you created.
Universal UI For more information on grouped actions and their behavior in the Universal UI, see Group actions in the action bar.
Add a report to a menu
If a report is linked to a table, it appears in the ribbon and the context menu of this table. You can also add a report to one or more menus (tree view, list bar, and tiles). In this way, users can print the report without having to open another screen.
To add a report to a menu for the first time:
menu User interface > Menus > tab Menu
- For more information about the configuration of a menu and how to add a report to it, see the Menus guide.
To edit a menu:
menu Processes > Reports > tab Menu
This tab is read-only. Here, you can see to which menus a report is connected.
- Execute the task Go to menu
 to open the corresponding tree view, list bar, or tile menu item where you can edit it.
Create a report variant
With a report variant, you can create an alternative user experience for the same report. Not all default settings can be changed in a report variant, but it can, for example, have a different icon and translation, default values, and conditional layouts than the default. For more information on variants, see Variants.
A report variant is not a copy of the original report. A variant is still linked to the original report, while a copy is not. To create a copy of a report, see Copy a report.
menu Processes > Reports
- Select the task Create a report variant.
- In the pop-up, select the Report for which you want to create a variant.
- Enter a Report variant name.
- Optional. To generate a different translation for the variant, select the checkbox Translate.
- Select Execute.
- Go to the tab Variant to set up the report variant.
In the tab Changes compared to default, you can view a list of the differences between a report variant and its default report. For more information, see Compare a variant to its default.
Alternative translation for a report variant parameter
Alternative translations can be created for a report variant parameter in a form or tooltip. This translation is used in the user interface instead of the default translation.
To create an alternative translation for a report variant parameter:
menu Processes > Reports > tab Variants > tab Report parameters
- Select the checkbox Alternative translations.
- Enter an alternative translation Label.
- Save the settings.
- Go to the tab Alternative translations.
- Add an alternative translation.
Alternative translation for report variant buttons
Changing a button's translation can be useful for context-specific actions, to clarify the action being performed. You could, for example, change the translations from 'Confirm' to 'Accept', and from 'Cancel' to 'Decline'
To create an alternative translation for a Confirm or Cancel button in a report variant:
menu Processes > Reports > tab Variants > tab Form > group User interface
-
Add a translation label:
- For the 'Confirm' button: select the checkbox Confirm button alt. transl. and enter a translation Label.
- For the 'Cancel' button: select the checkbox Cancel button alt. transl. and enter a translation Label.
-
Go to the tab Confirm/Cancel button alternative translations.
-
Enter the alternative translation.
If you have added alternative translations for the 'Confirm' and 'Cancel' buttons on report level, you can disable them for its variant. The report variant will then follow the default translations instead.
Printing a report
When the report is fully defined within the Software Factory, a preview can be viewed on the screen in the user interface.
In the Universal GUI, by default the report preview will open in a new browser tab.
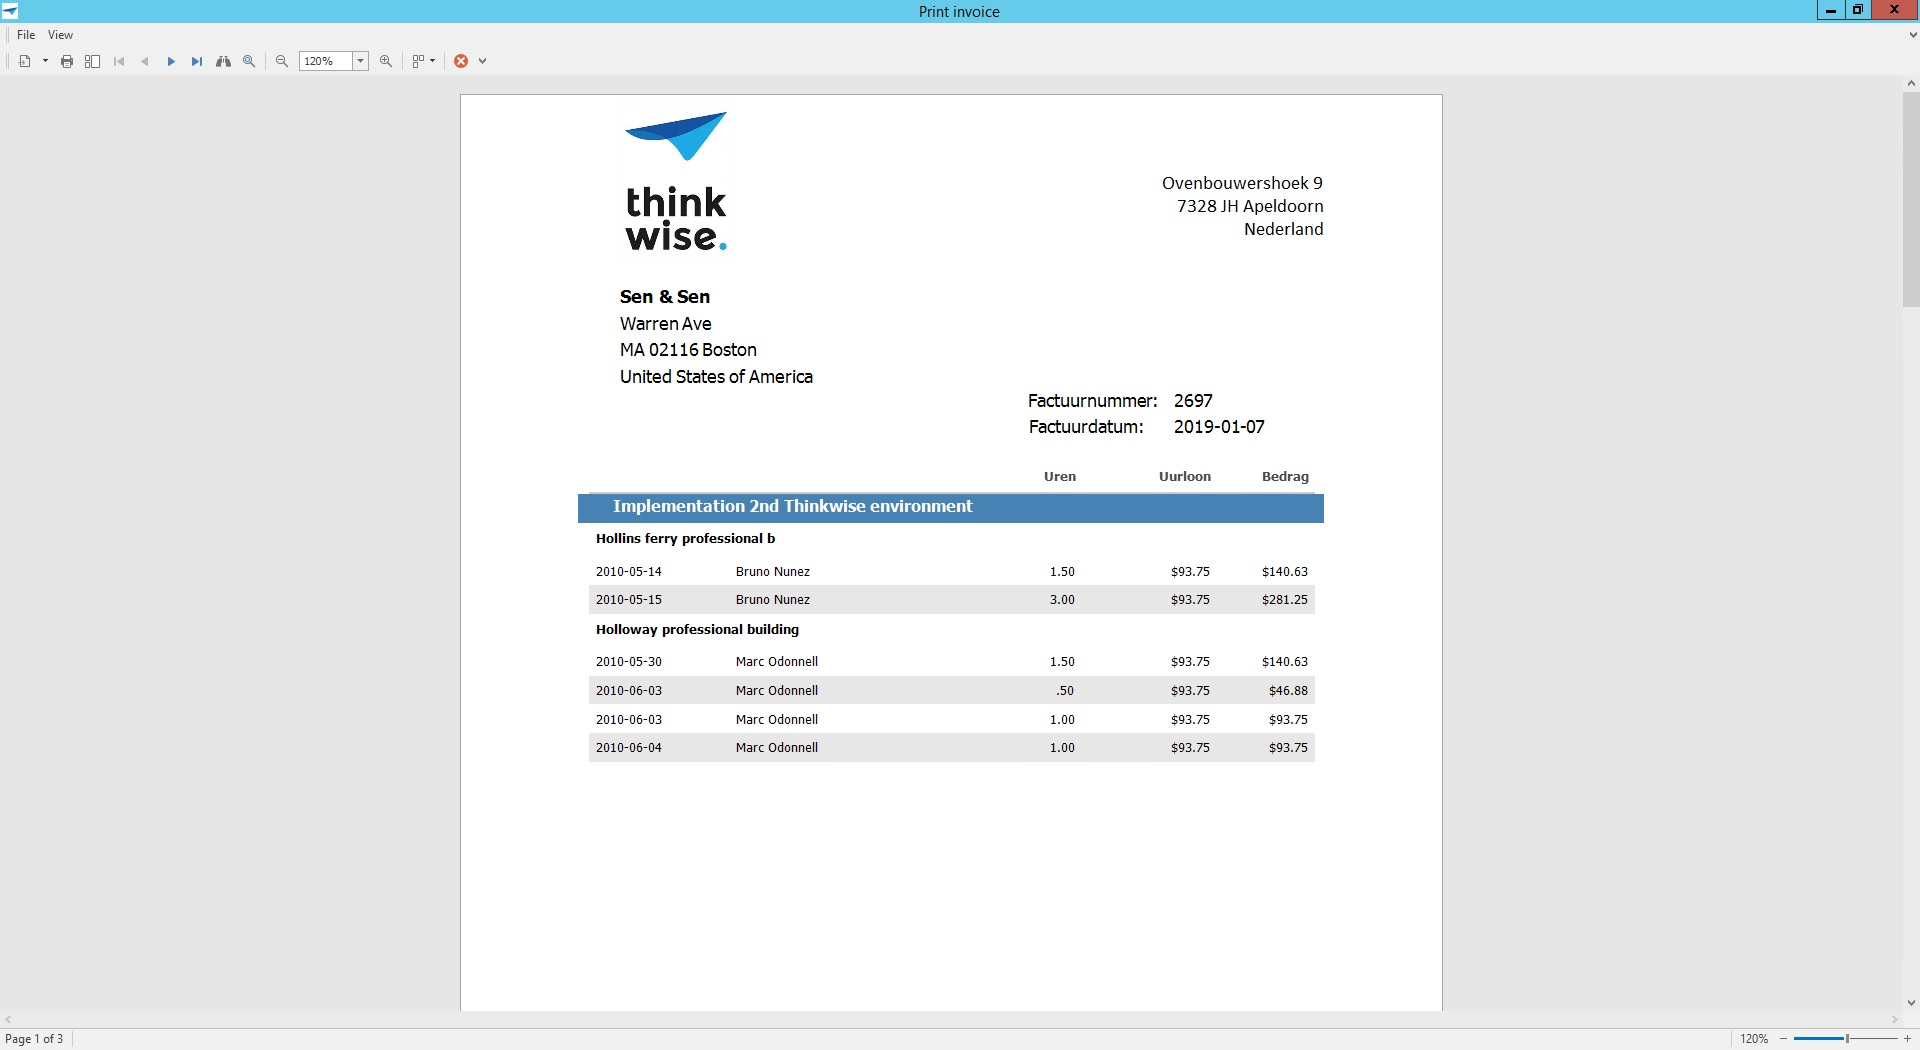 Example of a report preview
Report shortcut
Optionally, you can select a keyboard shortcut which can be used to execute the report. Make sure that the screen does not contain multiple reports using the same shortcut. Also do not use a shortcut that is already used by the GUI, such as Ctrl + R. For more information, see Shortcuts (used by GUI's). Validations are in place to prevent you from selecting such shortcuts.
Await result
menu Processes > Reports > tab Settings
Reports can take a while to process. There are four options to give instructions about what to do with these reports.
- Yes - The user has to wait for the result and a progress indicator is shown.
- Yes (no progress indicator) - The user has to wait for the result (the GUI freezes and hourglass is shown).
- No - The action is executed in the background and the user can continue working.
- Optional - The user has to wait (option 1) but has the possibility to continue the action in the background (option 3).
The display parameter can be used to distinguish between multiple instances of a report in the async action dialog.
Load balancing reports
IndiciumIndicium uses a plugin system for certain report types to spawn multiple workers. This can increase the request throughput at the cost of more RAM resources. For users, this means it reduces the time they have to wait for their report when the initial request to a plugin process is made.
The report types that this can be configured for are:
- CrystalReports
- DevExpress
- SSRS:Local
- SSRS:Server.
The use of this plugin can be enabled and configured in Indicium. Add the following settings to Indicium's appsettings.json configuration file:
| Setting | |
|---|---|
Reporting:<ReportType>:**Enabled** | The default is 'true'. Set to 'false' to skip loading the dependency entirely. |
Reporting:<ReportType>:**WorkerCount** | The default is 1. This setting controls how many plugin processes are spawned for that report type. |
Reporting:<ReportType>:**Preload** | The default for this setting is 'false' (wait until the first request for a report type is made before starting the process). Set to 'true' to make Indicium spawn and warm up the plugin processes by exporting a dummy report during startup. Note: the preload does not hit data sources contained in the report. So even with preload enabled, there are still some assemblies that may be loaded at the initial request. |
Example configurations:
{
  "Reporting": {
    "CrystalReports": {
      // Start and preload a single plugin worker process for Crystal Reports.
      "Preload": true
    },
    "DevExpress": {
      // Start and preload 3 plugin worker processes for DevExpress reports.
      "Preload": true,
      "WorkerCount": 3
    },
    "SSRS": {
      // Disable SSRS local and server report types.
      "Local": {
        "Enabled": false
      },
      "Server": {
        "Enabled": false
      }
    }
  }
}
Supported report types
menu Processes > Reports > tab Settings
The following report types are supported by the Software Factory:
- DevExpress Reports (preferred)
- Crystal Reports
- i-net Clear Reports
- None
- SSRS (Local) / SSRS (Server)
- SQL Server Reports
- Windows command (deprecated)
- GUI code (deprecated)
- Microsoft Word (deprecated)
DevExpress Reports (preferred)
DevExpress Reports can display any styled and formatted text, such as RTF and HTML, from your application. The Thinkwise DevExpress Report Designer is free of charge and can be downloaded from TCP.
For more information, see also the following topics:
- When generating DevExpress reports on Linux, there are some additional requirements and restrictions. See: DevExpress reports on Linux.
- Because reports are stored in the database, you cannot use sub-reports as separate files. For a solution, see Create a Master-Detail Report with a Detail Report Band.
- To enable logging for DevExpress reports, use the following extended properties:
WriteLogToFile- To enable logging for DevExpress. The log file is in folder\{Application}/Logs/.LogSeverity- Determines the log level,Error,Warning, orInfo.Infois the most detailed level.
-
For more information about load-balancing reports, see Load balancing reports. Use this, for example, to speed up the first report after an Indicium restart.
Thinkwise.DevExpress.ReportViewer.exe(to preview the generated report) contains a digital signature. A digital signature verifies the identity of the file's distributor and ensures that the file contents have not been altered since the signature was applied.
DevExpress reports on Linux
You can generate DevExpress reports on .NET 10. This allows Indicium to generate reports on Linux.
Please note:
- Reports targeting DB2 sources are not supported.
- You must install and update the dependencies mentioned here.
- On Linux, Indicium uses the .NET 10 version of the DevExpress reports plugin by default.
Windows will continue to use the .NET Framework 4.7.2 version by default, but you can use the .NET 10 plugin by changing the
Runtimeapp setting toNET:
{
  "Reporting": {
    "DevExpress": {
      "Runtime": "NET"
    }
  }
}
Crystal Reports
A report in Crystal Reports can make use of views, but SQL queries can also be specified in the report. CR reports can be developed with the Crystal Reports Designer or with Visual Studio.
For more information about load-balancing reports, see Load balancing reports. Use this, for example, to speed up the first report after an Indicium restart.
Crystal Reports is not supported by PaaS cloud deployments (such as Azure Web Apps) and modern technologies like .NET Core. Instead, you can use DevExpress Reports for best support and compatibility.
Crystal report requirements
To use Crystal Reports in the Windows GUI or Indicium application tier, the Crystal Reports drivers must be installed on the client or web server. This concerns Crystal Reports Runtime 13 with service pack 21 up to 25 for the right OS. With both, the support for the ASP.NET Web components must be installed.
The latest Crystal Reports Runtime Engine (32/64 Bit) can be downloaded here by selecting the SAP Crystal Reports, version for Visual Studio software product or using these direct links to version 13.0.25:
Service pack 26 and above are currently incompatible with all Thinkwise products.
TLS 1.2 encryption protocol
Starting with Windows Server 2019, Microsoft has disabled the TLS 1.0 and 1.1 encryption protocols by default, It requires all connections to use TLS 1.2, for example, for SQL Server instances on Windows Server 2019. This can cause problems with Crystal Reports documents that use the default SQL Server drivers included with Crystal Reports, instead of the Microsoft OLE DB Driver.
To determine the connection that a report uses:
- Open the dialog box Set Datasource Location from the menu Database in the Crystal Reports designer.
- Open the node Properties.
- Check if the Provider is set to 'MSOLEDBSQL'.
If your provider is not set to 'MSOLEDBSQL', replace the drivers used by the report with the latest Microsoft OLE DB Driver for SQL Server, which be downloaded here.
To update the driver in the report file:
- Open the dialog box Set Datasource Location from the menu Database in the Crystal Reports designer.
- Select the connection to replace.
- Click Make New Connection to create a connection using the Microsoft OLE DB Driver for SQL Server, or select an existing MSOLEDBSQL connection. Do not use the Microsoft OLE DB Provider for SQL Server (SQLOLEDB).
- Select Update to replace the connection.
Repeat this for all Crystal Reports files.
An alternative, more future-proof solution is to migrate from Crystal Reports to DevExpress reporting, which does not require the installation of report or database drivers. The DevExpress report designer is part of the Thinkwise Platform and can be downloaded from TCP.
None
When your users select the Report button in the user interface, a report is generated and either previewed, printed, or exported. In some cases, you may want to change this default behavior.
For example, you may want to email the report directly without previewing or printing it. To do this, set the Report type to None. The report button in the user interface can then be used as a starting point in a process flow, allowing you to tailor its behavior to your specific needs.
You can also set the Task logic type to None for tasks, see Task logic type 'None'.
SSRS
SSRS stands for SQL Server Reporting Services. It is a (server-based) report generation system from Microsoft SQL Server. Reports drawn up with this system can present information from tables from one or more databases in an orderly fashion.
Because reports are stored in the database, you cannot use sub-reports as separate files. For a possible solution, see Add a Details Group (Report Builder and SSRS).
Reports are described in the Report Definition Language (RDL). This is a file format that is built up in XML. RDL reports can be made with the SQL Server Report Builder application.
There are two ways to deploy the RDL files:
- Locally on the client computer.
- Server-side on a server with SQL Server Reporting Services installed.
Depending on the environment in which the reports are generated, these can be exported in various formats.
SSRS (Local)
Local reports work in the same way as other report types, such as Crystal Reports. The report is generated on the basis of the RDL file that is specified for the report in the file specification field, for which use is made of the end application database connection. This means that the connection string that is specified as data source for any data sets is ignored in the RDL file.
For more information about load-balancing reports, see Load balancing reports. Use this, for example, to speed up the first report after an Indicium restart.
 Specify SSRS (local) file specification
SSRS (Server)
In this variant, the reports are generated on a report server. The relative path to the report on the server must be specified in the file specification field.
The location of the report server has to be passed on to the GUI via the INI parameter ssrsreportserver.
The report server can run in native mode or SharePoint. Native mode is the default for this. These default models have been tested by Thinkwise (though those for SharePoint have not yet been tested) in the current release. For now, it is therefore expected that the report server be in native mode.
Reports that are generated on a report server use the connection string that is assigned for each data source to retrieve the data set. Ensure that the reports that are used in a test environment have the correct connection string when this is rolled out to the live environment.
For more information about load-balancing reports, see Load balancing reports. Use this, for example, to speed up the first report after an Indicium restart.
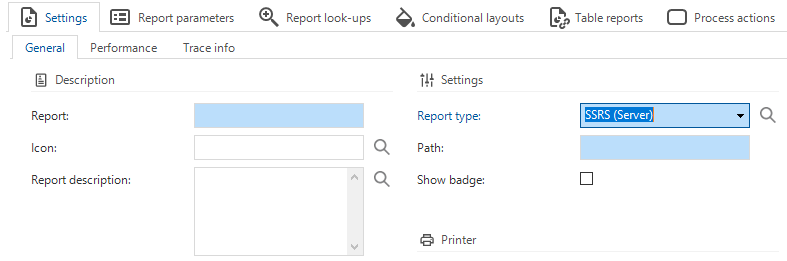 Specify SSRS (Server) file specification
Oracle and DB2
Reports made with SSRS can also retrieve data from Oracle and DB2 databases, provided that the correct software is available for this on the system on which the report is generated.
For Oracle connections, the Oracle Client needs to be present on the system.
When using the Oracle Client together with the Microsoft SQL Server Report Builder, it is necessary to have the 32 bit version of the Oracle Client installed. The 64 bit version will unfortunately not work because the report Builder itself is a 32 bit application. Use can be made of the 64 bit Oracle Client for end applications.
Connections to DB2 databases are created in SSRS via OLE DB. The ADO.NET bindings, which can be installed via the IBM Client Access, are required for this.
Report Builder
The Microsoft SQL Server Report Builder software to develop reports can be downloaded from this page:
A report consists of the following basic components:
| Component | Description |
|---|---|
| Built-in Fields | A number of pre-defined calculated fields, such as the current page number or the user that has called the report. |
| Parameters | Parameters within the report that can be used when retrieving a Data Set or the calculation of an expression. Depending on the type of connection that is used, this is generated by the Report Builder or has to be added manually. |
| Images | Illustrations that can be used within the report. |
| Data sources | A Data source describes a connection to a database. A connection string can even be typed in or one can be built via a dialogue. Furthermore, for example, a login method can be selected to be used when setting up the connection. |
| Data Sets | A Data Set contains the resulting set of a query or stored procedure on a Data source. These can be used, for instance, to fill tables and graphs within the report. When using a stored procedure, parameters are automatically added to the report for both SQL Server and Oracle and DB2 connections. For a query within the Data Set itself, a parameter name with the correct prefix ("@"/":") can be indicated with SQL Server and Oracle connections. During the testing of the query, the Report Builder will automatically add these parameters to the report. With DB2, use is made of an OLE DB connection. Therefore, the user has to mark parameters in the query with a question mark. This then has to be assigned to a parameter within the report on the Parameters screen of the Data Set. |
Windows command (deprecated)
Windows GUIThe same as for Windows command tasks but with the name of the parameter in the File specification field. For example, to link in an existing pdf as a report.
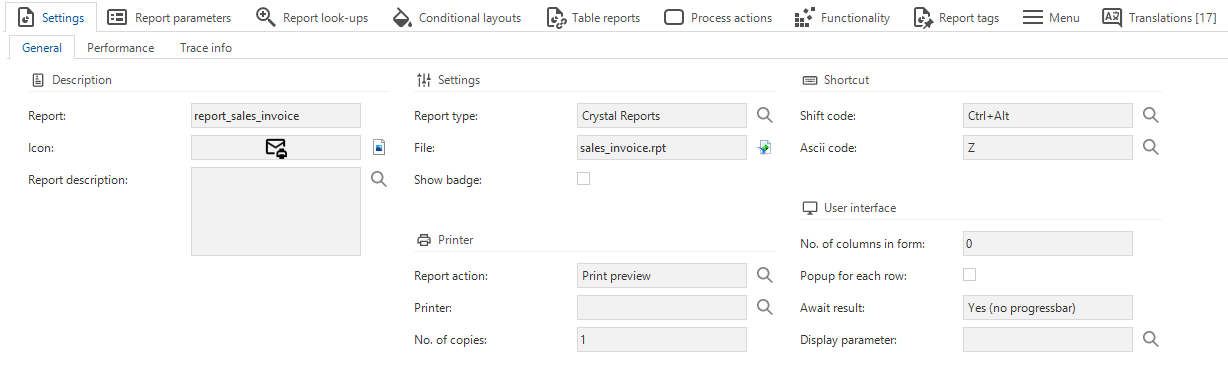 General settings when creating a report
GUI code (deprecated)
Windows GUIThis option allows custom tasks, such as the TSFReportMailer, to be linked in as a report. The name of the custom task should be entered in the File specification field.
Microsoft Word (deprecated)
Windows GUITo generate reports in Word, a macro and a template have to be created in Word. Word does not work in web and is not always reliable because of the macros.
Create a template
-
Open Microsoft Word
-
Go to the Mailing Lists tab
-
Click Select Addresses
-
Click Use existing list
-
Click New source
-
Select Microsoft SQL Server and click Next
-
Enter the server name and logon credentials and click Next
-
Select the correct database
-
Select the correct table and click Next
-
Save the file anywhere on your system and click Finish
-
Set up the document with the desired merge fields
-
Click the Start Mail Merge button
-
Click Normal Word Document
Create a macro
-
Go to the View tab
-
Click Macros
-
Select your document under View Macros
-
Type the text field under macro name TSFReport_+ your report_id
-
Select the correct document the Macro has to be linked to:
 Available options of macros in a drop down list
 -
Click on the Create button. The Visual Basic editor will open.
-
Copy and paste the macro code as displayed on the next page to the Visual Basic editor.
-
Modify the macro with respect to the following points
- strFolder
- strQuery
-
Close the Visual Basic editor by pressing the X button.
-
Save the Word document to your system, choose a file type: Word Macro-Enabled Template (.dotm).
-
Place the file in the designated folder on the server.
-
Create the report in the Software Factory.
Macro code:
Dim strODCFile As String
Dim strConnection As String
Dim strQuery As String
' Use your folder name...
strFolder = C:\\your_folder\\Reports\\
' Use your .odc name...
strODCFile = strFolder & thinkwise.odc
' Build the connection string
' You may well need more here, but I am following
' your ADO connection string
strConnection = Environ(TSFTOWORD_CONN)
' Build the Query string
strQuery = SELECT \ FROM your_table where  + Environ(TSFTOWORD_SQL)
' Open the data source
With ActiveDocument.MailMerge
'.MainDocumentType = wdNotAMergeDocument
.MainDocumentType = wdFormLetters
.OpenDataSource _
Name:=strODCFile, _
Connection:=strConnection, _
SQLStatement:=strQuery
'ActiveDocument.ResetFormFields
End With
ActiveWindow.Visible = False
ActiveDocument.MailMerge.Execute
Application.Quit (False)
Troubleshooting reports
Script execution disabled
Upgrading the DevExpress version in the Thinkwise Platform release 2025.1.14.0 caused reports with C# scripts to fail. The following error message when trying to run such reports is shown:
"DevExpress.XtraReports.ScriptExecutionException: Report scripts were found in the application while script execution is disabled."
To solve this, you can enable script execution in the appsettings.json file of your Thinkwise Platform application.
To protect your application from potential security threats, DevExpress reports disable scripts by default. Instead, use "Expression bindings" as described in Data Binding Modes. If you choose to enable scripts, do so only with a full understanding of the risks, as improper use can compromise application security.
Add the following to the appsettings.json file:
{
  "Reporting": {
    "DevExpress": {
      "UnsafeScripts": true
    }
  }
}