Quality Dashboard
Introduction to the quality dashboard
The goal of the Quality Dashboard is to provide a quick overview of the quality of a specific branch in the Software Factory:
- When you open the dashboard from the menu (menu Quality > Dashboard), it will show the branch you are currently working in.
- When you open the dashboard from the Model overview (menu Model > Model overview > tab Quality dashboard), it will show the branch you selected in tab Models.
This chapter provides an overview of the quality dashboard's data and possibilities.
 An example of the Quality dashboard
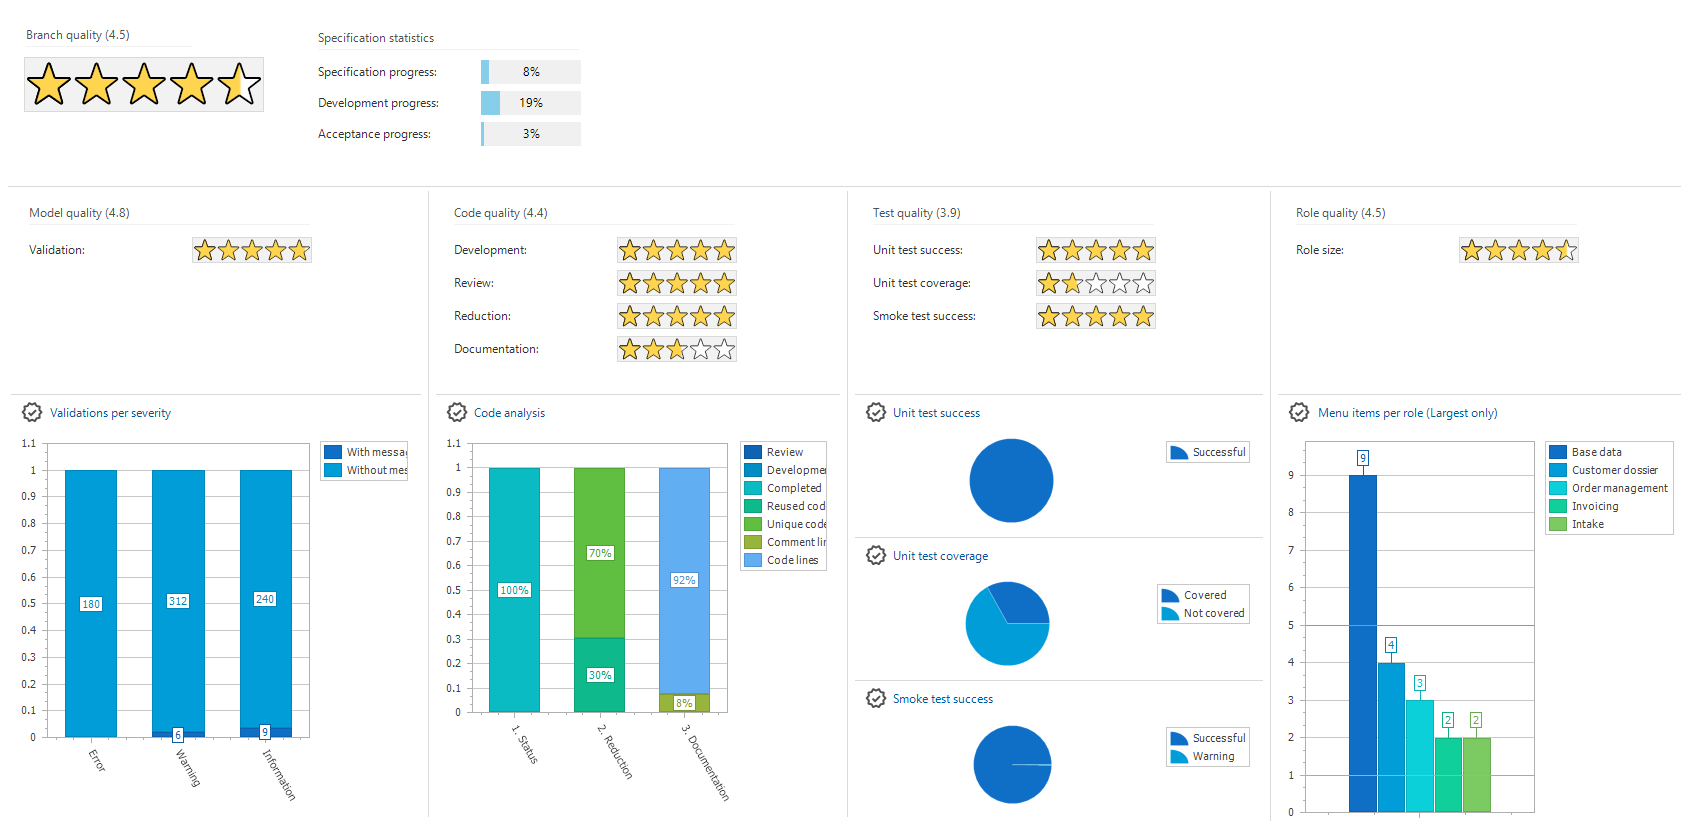
Branch quality
The Branch quality shows the average quality of the model, code, test, and role for the selected branch.
 Branch quality
Specification statistics
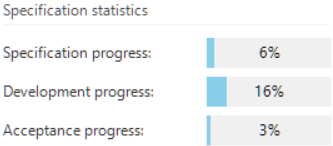
The Specification statistics show your work's progress instead of its quality. This data is obtained from menu Specification > Iterations. It provides information on Specification progress, Development progress and Acceptance progress.
 Specification statistics
Model quality
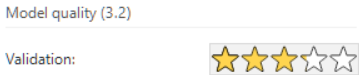
Model quality shows whether validations with messages have been solved sufficiently. More unsolved messages lead to a lower number of stars.
 Validation
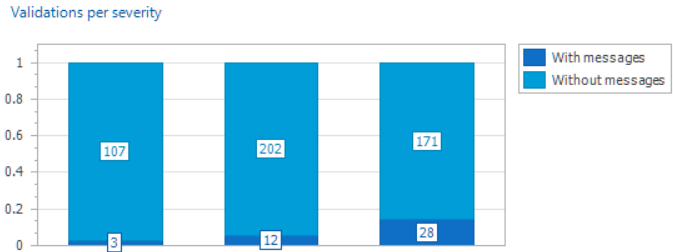
The Validations per severity chart provides an overview of the number of validations, with or without message, per severity type (information, warning or error).
To improve the model quality, check the validations and solve or approve them via menu Quality > Validation. Start with the most severe messages. So, first errors, than warnings and finally information messages.
 Validations per severity
Code quality
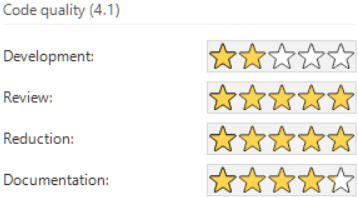
Code quality shows the quality of your code divided into four categories:
-
Development: the average number of control procedures in development per developer. To improve the quality, make sure that developers don't work on too many control procedures at once (less than 5) and that a control procedure is fully completed after finishing.
A score is assigned immediately at the start of a new model, even if no code has been written yet. The reason is that included base models are also taken into account.
-
Review: the total number of control procedures in review. To improve the quality, make sure to review each other's work as soon as possible and fully complete the control procedure after finishing.
-
Reduction: how often a control procedure has been weaved, 25 percent or higher is considered as high quality. Reusing templates leads to a higher quality software, because it reduces the chance of errors.
-
Documentation: the amount of comment in the code for program object items, 10 percent or higher is considered as high quality. Stars are awarded for each template separately, here the average amount of stars is shown. Comments contribute to the code's comprehensibility. An overview of the comments in the code can be found in menu Analysis > Templates > tab Cube. Right click in a form and select menu Cube views > Documentation > Ratio code / comment. To improve the quality, add comments where they lack most.
A score is assigned immediately at the start of a new model, even if no code or comment has been written yet. The reason is that included base models are also taken into account.
 Code quality
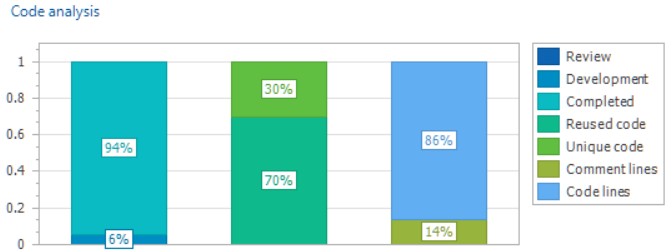
The Code analysis chart provides the same information visually:
- Status: review, development or completed
- Reduction: reused code vs unique code
- Documentation: the sum of all comment lines vs the sum of all code lines. Although the ratio might look good here (e.g. 10 lines of comment for 100 lines of code), separate templates can still lack the right amount of comment. This will be reflected in the number of stars.
 Code analysis
Test quality
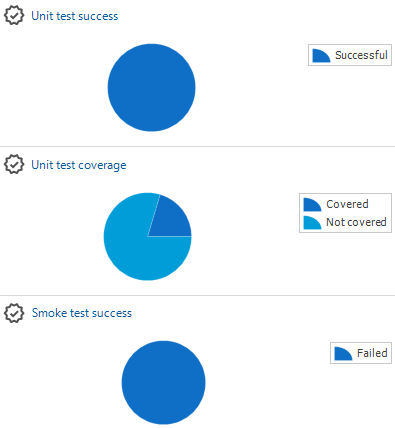
The Test quality shows the use and success of the available unit and process tests.
-
Unit test success: the percentage available unit tests with a successful result. To improve the quality, use the unit tests on a regular basis and solve any problems when they occur.
Five stars are assigned immediately at the start of a new model, even if no unit tests have been build yet. The reason is that only the unsuccessful tests are taken into account, and no unit tests means no unsuccessful unit tests. The actual amount of unit tests is rated at the Unit test coverage.
-
Unit test coverage: the percentage non-generated control procedures (only Type: 'Program object item') that is covered by a unit test. To improve the quality, build tests for more control procedures (Type: 'Program object item').
-
Smoke test success: the percentage of smoke tests that pass. Smoke tests with status Warning count as successful in the quality dashboard ratings, typically resulting from a query timeout. Currently, you cannot prevent this. The quality improves if more tests are successful.
 Test quality
The same information is displayed in a chart:
 Test quality chart
Role quality
Role quality shows how well roles are being used, based on the average number of menu items per role. The less menu items in a role, the better the quality.
A role should preferably contain only one menu item, more menu items might possibly lead to a security risk.

The Menu items per role chart shows the largest roles in your application (with a maximum of 5 roles). To improve the quality, reduce the number of menu items in the largest roles.
Five stars are assigned immediately at the start of a new model, even if no roles have been defined yet. The reason is that large roles lead to low ratings. So, no roles means no roles that are too large.

Disable automatic startup for the Quality dashboard
To help you and your team improve branch quality, the dashboard opens automatically after you start the Software Factory and select a model and branch, but only if the selected model is a work model. This provides daily insight into the quality level of the branch in which you are working. If you change the model by using the Switch branch task, the dashboard will not open automatically.
To stop the Quality dashboard from opening automatically:
menu Maintenance > Configuration > tab Configuration > Group Environment settings
- Clear the checkbox Start with Quality dashboard.