Maps
Introduction to Maps
With Thinkwise Maps you can visualize locations or track assets from within your application. You can use a map to create a visual representation of a single data set, such as a table or a view. For more information about the features in the Maps screen component, see the Universal user interface documentation.
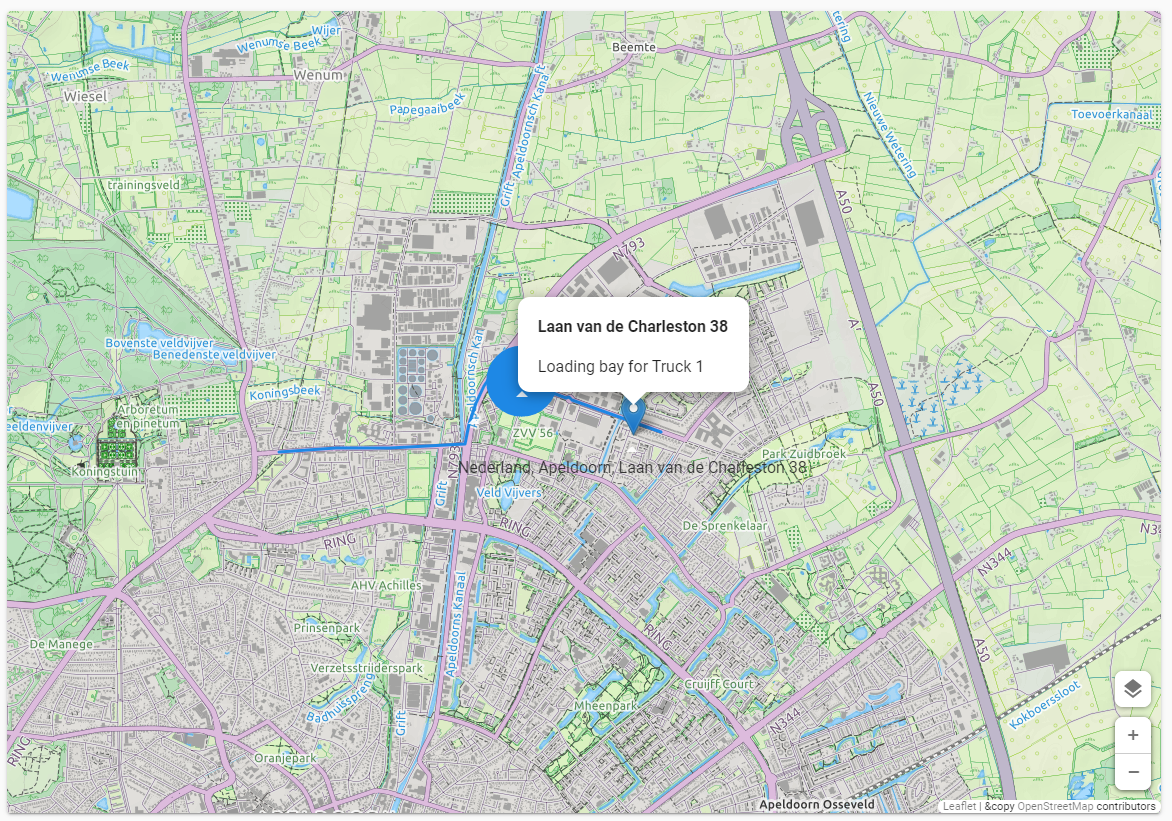 An example of data mapping: route planner
Third-party integrations for Maps
The Maps screen component is built on the Leaflet library, a popular open-source JavaScript library for creating interactive maps. It uses base layers to display the map (such as a street map or satellite map) and overlay layers to display additional information (such as locations, weather, or traffic data).
Base layer providers
For base layers, you can use virtually any map provider that supports Web Mercator map tile services (z,x,y URLs). Some popular examples are:
- Google Maps
- Here Maps
- OpenStreetMap
- MapQuest
- ArcGIS
- WikiMedia
- Thunderforest - offers OpenStreetMap maps enriched with additional data, such as points of interest (POIs) and landcover information.
For an extensive list of base layer providers, see the Leaflet Provider Demo.
You can also use non-map base layers for your maps, such as floor plans or images. See the Leaflet non-map base layers.
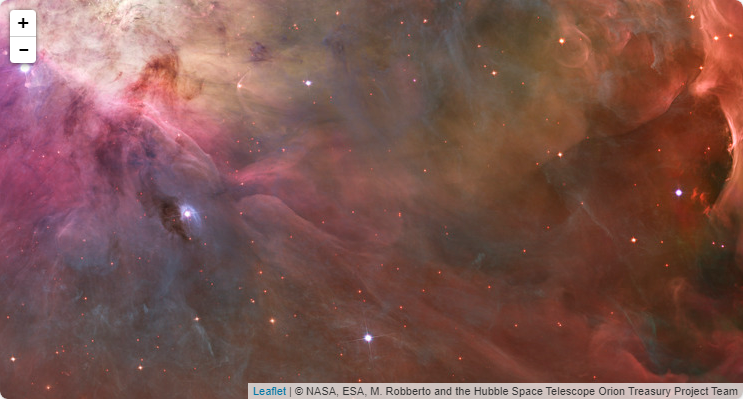 An example of a non-map base layer (Hubble image)
Overlay layer providers
In addition to base layers, you can add overlay layers to your map to display additional information. This can be data from your application, visualized with markers and circles for coordinates, polylines for routes or paths, and polygons for areas or regions. Additionally, you can use overlay data from a large number of third-party services, like weather and traffic information, locations of flights or vessels, wind turbines, and more.
For an extensive list of overlay layer providers, see the Leaflet Provider Demo.
Geocoding providers
To transform addresses into coordinates or to calculate the route between two or more locations, you can use the generic web connections in the Thinkwise Platform to call geocoding services from a range of providers, for example:
- Google Maps
- ArcGIS Geocoding Service
- OpenStreetMap Nominatim
The Leaflet website also provides a list of Routing and Geocoding services.
Set up a map in your application
Prerequisites for maps
To show a map in your application, the table or view must have a screen type with a Maps component. For more information, see Screen types.
Example model with a map
An example model with a map is available in the Thinkstore. It is called Maps and routes and its purpose is to teach how to work with the Maps component in the Universal GUI. The example model uses two Web connection endpoints for retrieving the GPS coordinates and routes. Note that you need to get your own API key from Google and enter it in the [Web connection].
Maps and routes includes a menu for addresses and routes:
- Adding an address initiates a process flow that uses the Web connection to retrieve and display the GPS coordinates on the Maps component.
- Once you have at least two addresses, you can add a route. The Web connection retrieves and displays the fastest route on the Maps component.
How to set up a map
Setting up a map consists of the following steps:
- Add a map to your application.
- Add a base layer for the map. This is the background map that shows roads, land, and buildings.
- Add an overlay to add extra information on top of the base layer, such as weather or traffic information.
- Add data mappings to visualize data from your application on the map, such as routes, markers for locations, or areas.
1. Add a map
To add a map to your application:
menu User Interface > Maps > tab Default
-
Select a table or variant.
noteFor a variant, you can only change the initial latitude, longitude, and the zoom level.
-
Select the Table or view to which you want to add a map.
-
To define Linked columns to populate the map with entities, select a Data mapping column. This is the column that contains the data to be displayed on the map. See:
-
Select the Lat/long column that contains the location coordinates for the entity. See:
-
Select the Popup column that contains the HTML data or plain text that will be displayed when hovering over an entity on the map.
Each location marker on the map shows a label when the user hovers over it. By default, the label is taken from the table's lookup display.
-
To use a custom label for a location marker, select the checkbox Use custom label column and select the Label column you want to use. If you do not select a column, no label will be shown. See also Remove labels from location markers.
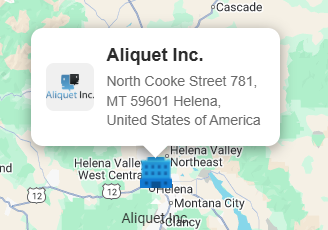 Label for a marker on a map
 -
To enter an initial location to the map, enter the Latitude and Longitude to initially center the map on that location. See also Allow users to move location markers on a map.
-
Set the Zoom level (a number, check with your provider about the scale used).
-
Optional. To allow users to add a marker or geometric shapes to the map, select a creation task for geometric types. For more information, see Allow users to add a marker or geometric shape to a map.
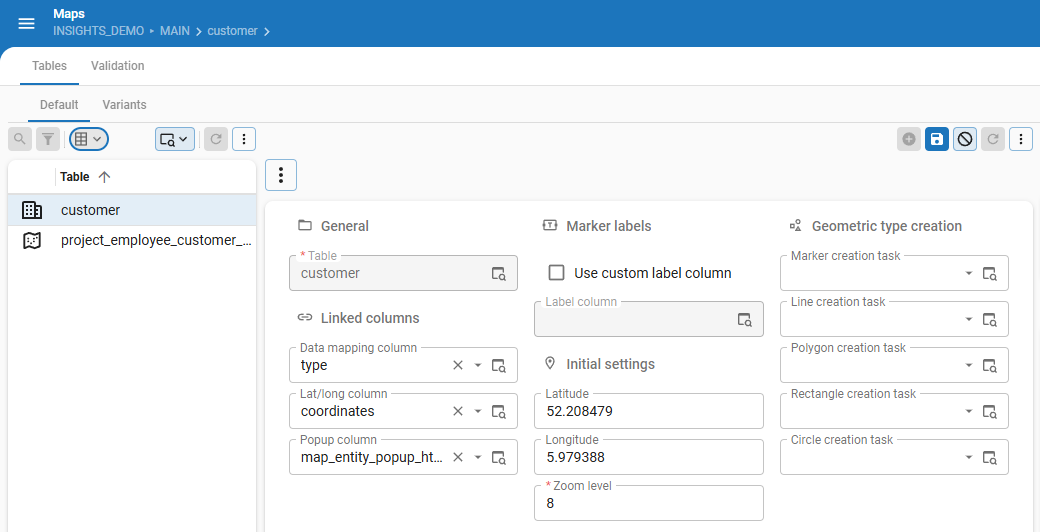 Set up a map for your application
2. Add a base layer
The base layer is the background map that shows elements like roads, land, water, and buildings.
For a variant, you can only select whether the base layer is shown or not.
To set up a base layer for your map:
menu User Interface > Maps > tab Default > tab Base layers
- Enter a Base layer URI to retrieve the layer information.
- You can use an external provider. See Base layer providers.
-
A tile layer in a map is a way of displaying geographic data by dividing the map into many small square images called tiles, each representing a portion of the map at a certain zoom level. The tiles reside on a server and are accessed by a direct URL request from the browser.
Example base layer URI for Google Maps
This is an example of the Google Maps URI:
https://mt0.google.com/vt/lyrs=m&hl=en&x={x}&y={y}&z={z}Where:
lyrs=m– Standard roadmap (default Google Maps view).lyrs=s– Satellite imagery only.lyrs=h– Hybrid view (roads overlaid on satellite imagery).lyrs=t– Terrain map.lyrs=p– Terrain map with roads.lyrs=y– Hybrid map (similar tohbut may include additional overlays).lyrs=r– Altered roadmap (possibly a different rendering style).{z}- zoom level{x}and{y}- tile coordinates
- Enter settings like minimum and maximum zoom levels.
- Optional. Use the field Attribution to store the attribution HTML snippet. This is a piece of HTML code to display the source of the map data, such as "Google Maps©".
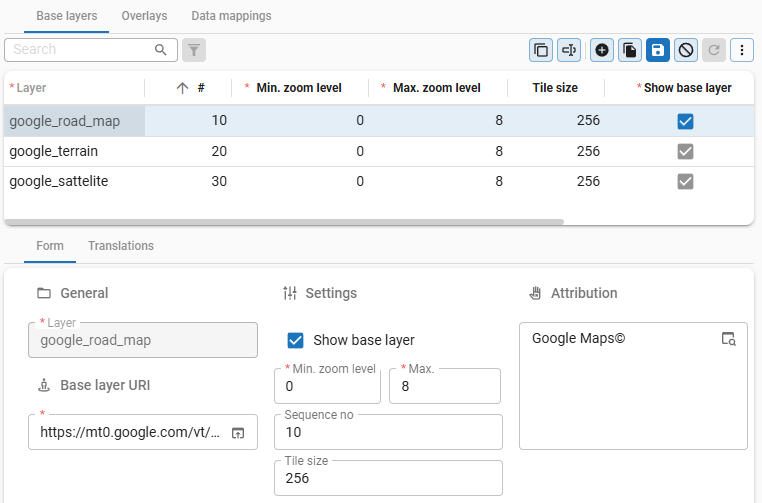 Base layer settings for maps
3. Add an overlay
An overlay can be shown on top of the base layer to add extra information, such as weather or traffic information. An overlay works similarly to how a base layer works.
If you only want to overlay a single element, using a data mapping instead of an overlay might be a better alternative. For more complex overlays, setting up a tile layer to use as an overlay is more suitable.
For a variant, you can only select whether the overlay is shown or not.
To add an overlay to your map:
menu User Interface > Maps > tab Default > tab Overlays
- Enter an Overlay URI.
You can use an external provider. See Overlay layer providers.
-
A tile layer in a map is a way of displaying geographic data by dividing the map into many small square images called tiles, each representing a portion of the map at a certain zoom level. The tiles reside on a server and are accessed by a direct URL request from the browser.
Example base layer URI for Google Maps
This is an example of the Google Maps URI:
https://mt0.google.com/vt/lyrs=m&hl=en&x={x}&y={y}&z={z}Where:
lyrs=m– Standard roadmap (default Google Maps view).lyrs=s– Satellite imagery only.lyrs=h– Hybrid view (roads overlaid on satellite imagery).lyrs=t– Terrain map.lyrs=p– Terrain map with roads.lyrs=y– Hybrid map (similar tohbut may include additional overlays).lyrs=r– Altered roadmap (possibly a different rendering style).{z}- zoom level{x}and{y}- tile coordinates
-
- Configure the settings, such as minimum and maximum zoom levels and the overlay's opacity.
- Select the checkbox Show overlay to make the overlay available. Use this, for example, for variants.
- Select the checkbox Show in menu to make the overlay available to your users for selection in the map's legend.
- Optional. Use the Attribution field to store the attribution HTML snippet. This is a piece of HTML code to display the source of the map data, such as "Google Maps ©".
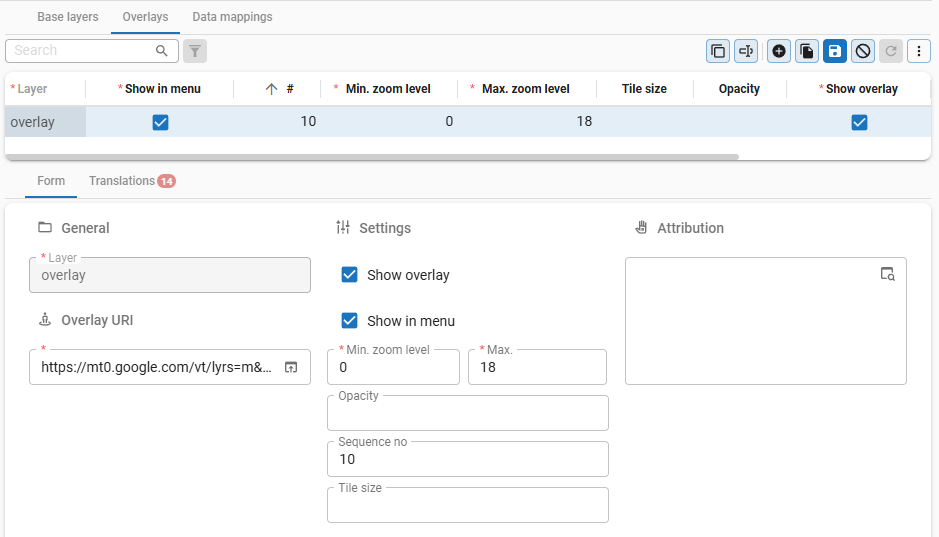 Overlay settings for maps
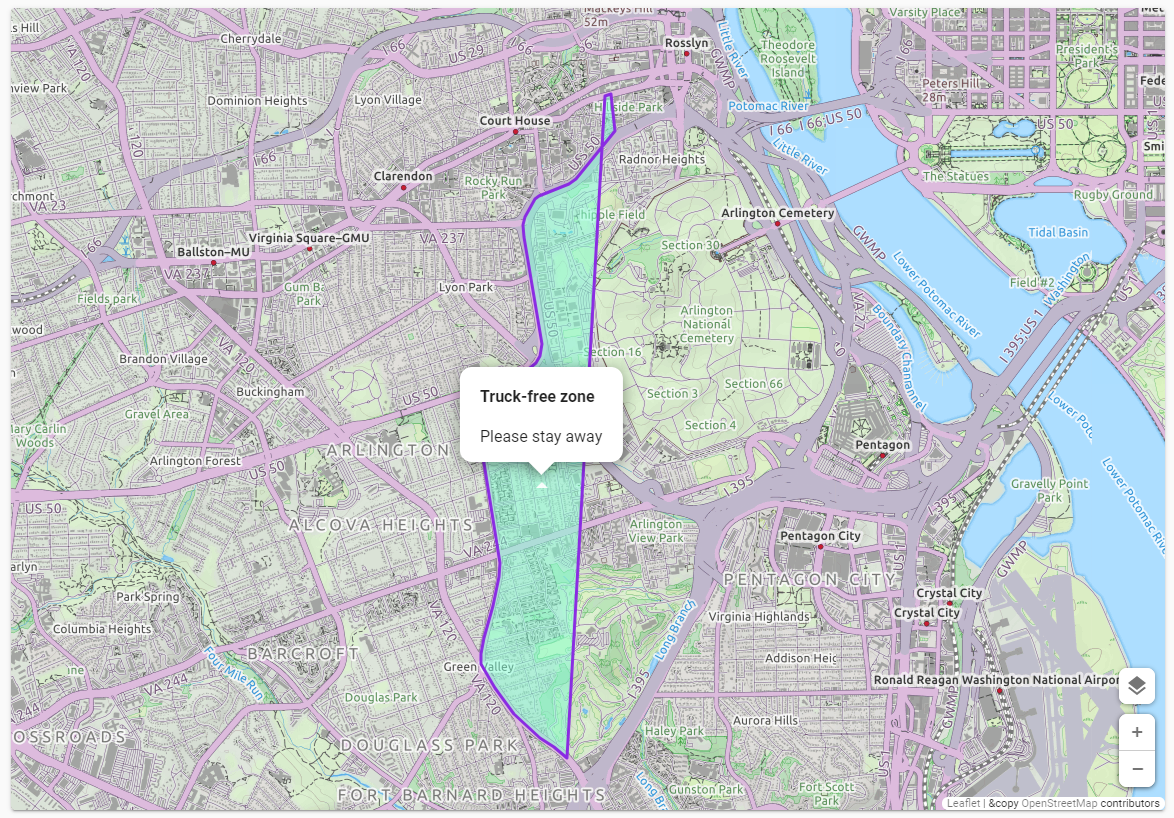 An example of an overlay in a map
4. Add data mappings
With data mappings, you can make data from your application visible on the map.
Example and use cases
- For a table with customer addresses you can:
- Make each address a marker on the map, displaying the customer's location.
- Enter a Status to change the marker color, indicating whether the customer is active or inactive.
- You can visualize delivery routes by mapping the start and end points of each route as location markers, with a polyline connecting them.
- You can show the estimated delivery time or distance as a pop-up when clicking on the route.
- For a fleet management application, you can track vehicles by mapping their current GPS coordinates as location markers.
Example: Truck-free zone
In this example, a data mapping of a polygon defined by coordinates describes an area where no trucks are allowed to drive in a city.
Set up a view or table containing columns with the coordinates that define the polygon in JSON, for example:
   {
   "CoordSets": [
         [
            {
               "Lon": "6.932740",
               "Lat": "53.329700"
            },
            {
               "Lon": "6.932740",
               "Lat": "51.329700"
            },
            {
               "Lon": "8.932740",
               "Lat": "51.329700"
            },
            {
               "Lon": "8.932740",
               "Lat": "53.329700"
            },
         ]
      ]
   }
Example set of coordinates
Create a domain with elements for each data mapping row and select the element you would like to display on it. Then, create a polygon data mapping and feed it with the coordinates that you have defined in a view or table.
Each data mapping row contains a definition of the type of entity you want to display on the maps.
In this case, there is only one row and it creates a polygon overlay.
You can define the border color, width, opacity, and the fill color and opacity of the polygon.
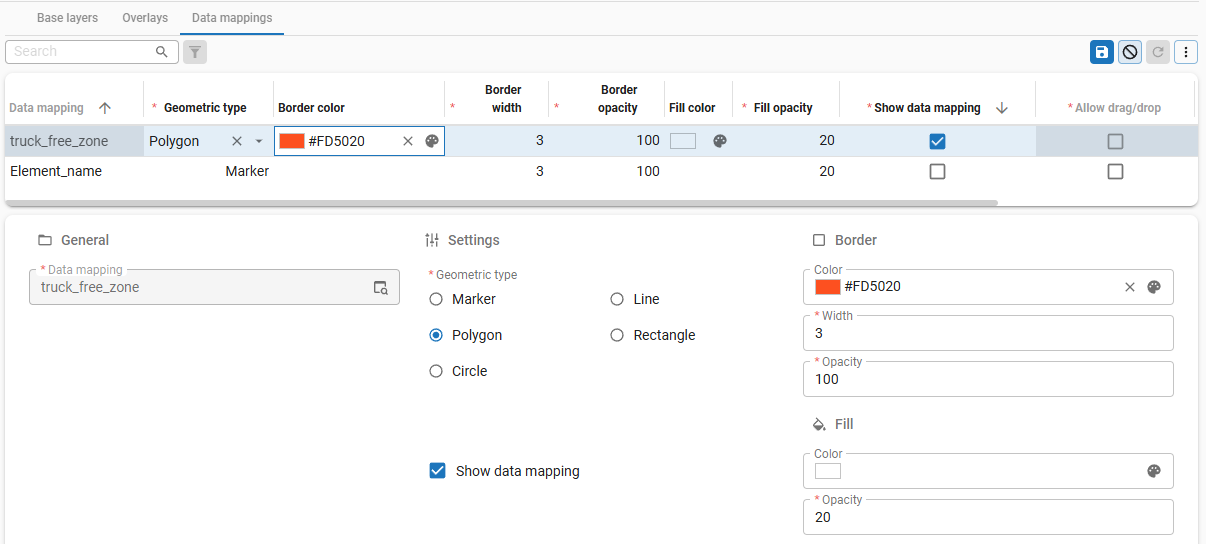 Data mapping of a truck-free zone
The two columns (coordinate and entity) should match the columns configured on your map component.
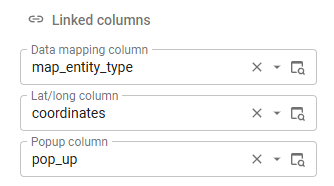 Linked columns in the maps component
For a variant, you can only select whether the data mapping is shown or not, and change the border and fill settings.
To set up data mappings for a map:
menu User Interface > Maps > tab Default > tab Data mappings
- In the field Data mapping, the domain element containing the data to display on the map is selected by default. The data mapping column is selected when you Add a map.
- Select a Geometric type for the data mapping. See also Available geometric types.
- If the geometric type is a Marker, see also Configure location markers for a map.
- If the geometric type is a Marker, you can allow users to move a predefined marker on the map by selecting the checkbox Allow drag/drop. See also Allow users to move location markers on a map.
- For all other geometric types, you can configure additional settings, like border and fill color.
- To display the data on the map, select the checkbox Show data mapping.
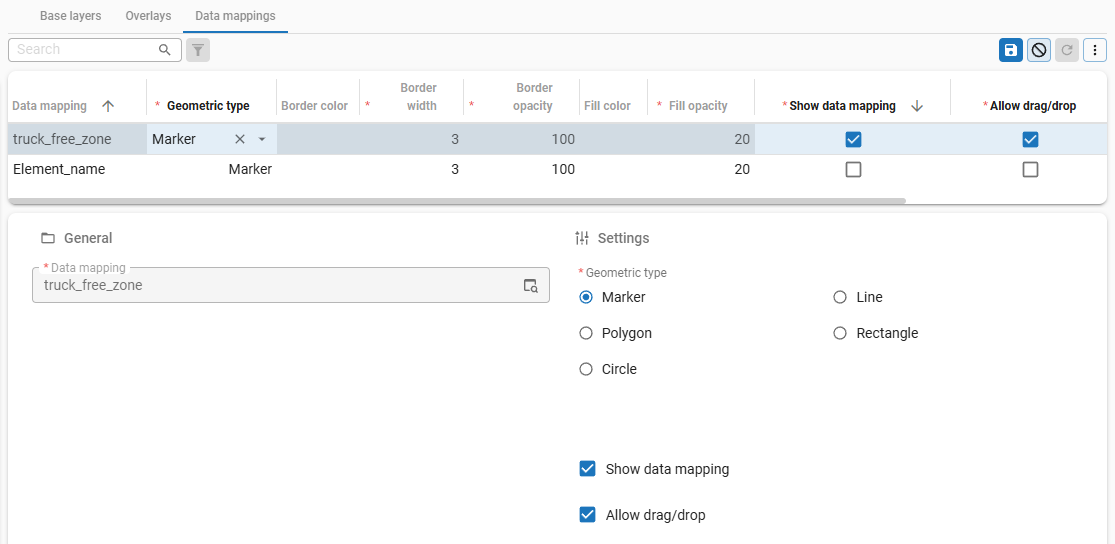 Data mapping settings for maps
Available geometric types
The following geometric types are available for data mappings:
- Marker – A marker is a single point representing a specific location on the map using a pair of coordinates (latitude and longitude). Examples: Displaying the location of a user, store, address, or incident on the map.
- Line – A line is a sequence of connected points that form a straight or curved path. Examples: Visualizing routes, roads, railways, or connections between multiple locations.
- Polygon – A polygon is a closed shape formed by three or more connected points defining the boundary of an area. Examples: Indicating areas such as a neighborhood, park, country border, or building lot.
- Rectangle – A rectangle is a four-sided polygon defined by two diagonal corner coordinates, usually aligned with the latitude and longitude axes. Examples: Selecting an area on the map, defining a bounding box, or marking a viewport.
- Circle – A circle is an area defined by a central point and a radius, typically expressed in meters. Examples: Showing a search radius (for example, 500 meters around a point), indicating reach or impact zones.
- Community post - Create Markers and Geographic Shapes on Your Map
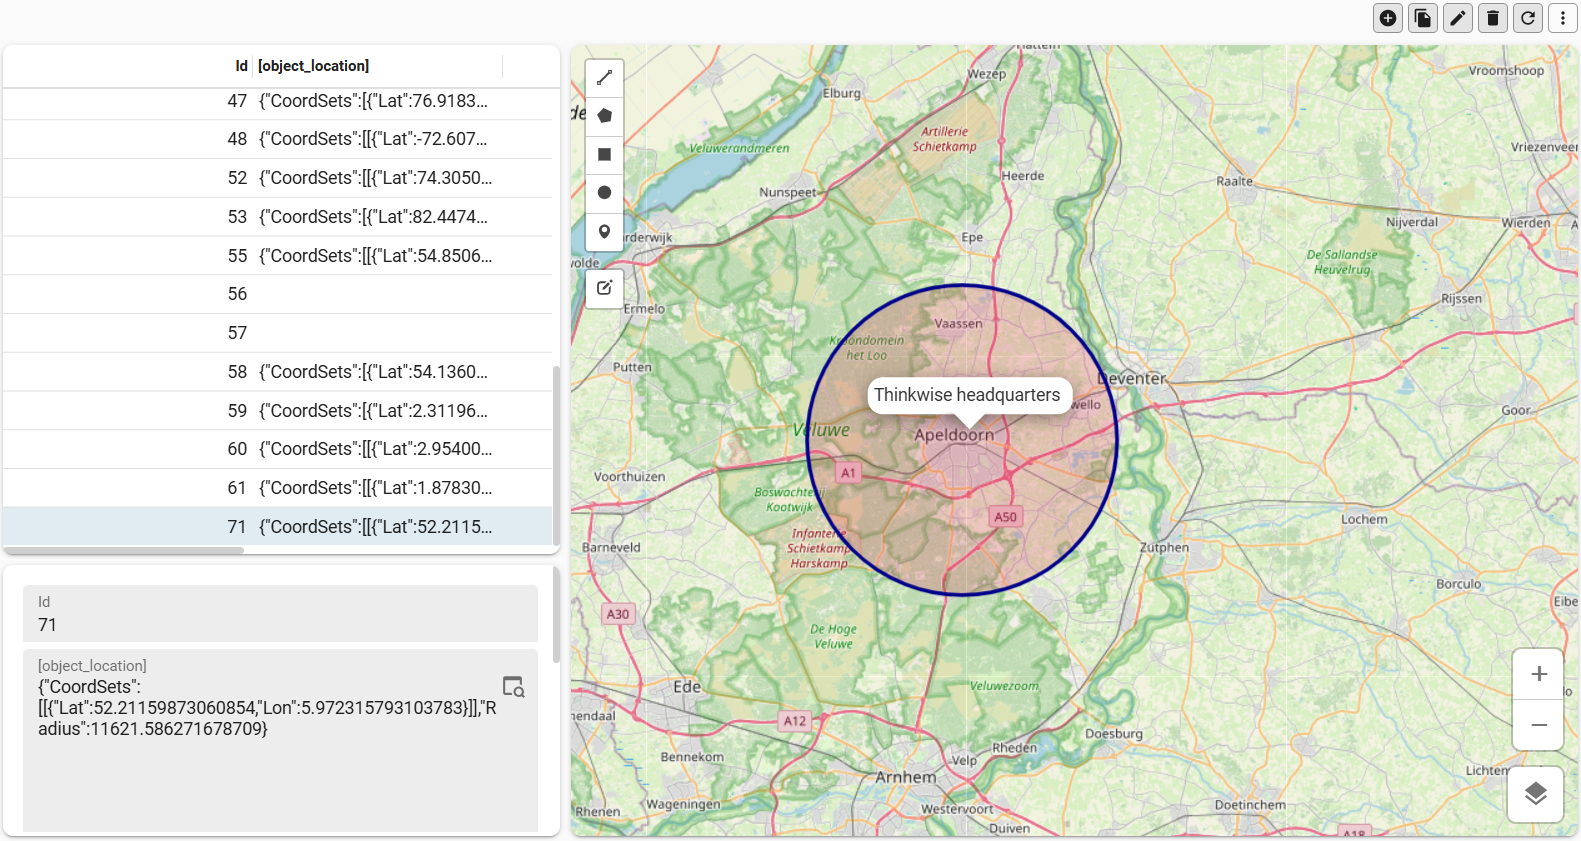 An example of geometric type: Circle
Allow users to modify data on a map
Allow users to add a marker or geometric shape to a map
You can allow users to add one or more of the following geometric types to a map: marker, line, polygon, rectangle, or circle.
This requires table tasks to be available:
- You can reuse table tasks across multiple maps.
- A task can only be linked to one geometric type within the same map.
- Each task must have a location parameter with an alphanumeric domain to which the user interface can pass the corresponding coordinates.
- If necessary, you can add more task parameters, such as a label, to the task. The user interface will then prompt the user to enter the required information when adding a geometric type.
- If the display type for the table task is Hidden, it is only available in the map, not in the task bar or action bar.
To allow users to add a geometric shape to a map:
menu User Interface > Maps > tab Maps > group Geometric type creation
- Select a table task in the [geometric type] creation task fields.
- Select the location parameter to which the user interface can pass the corresponding coordinates.
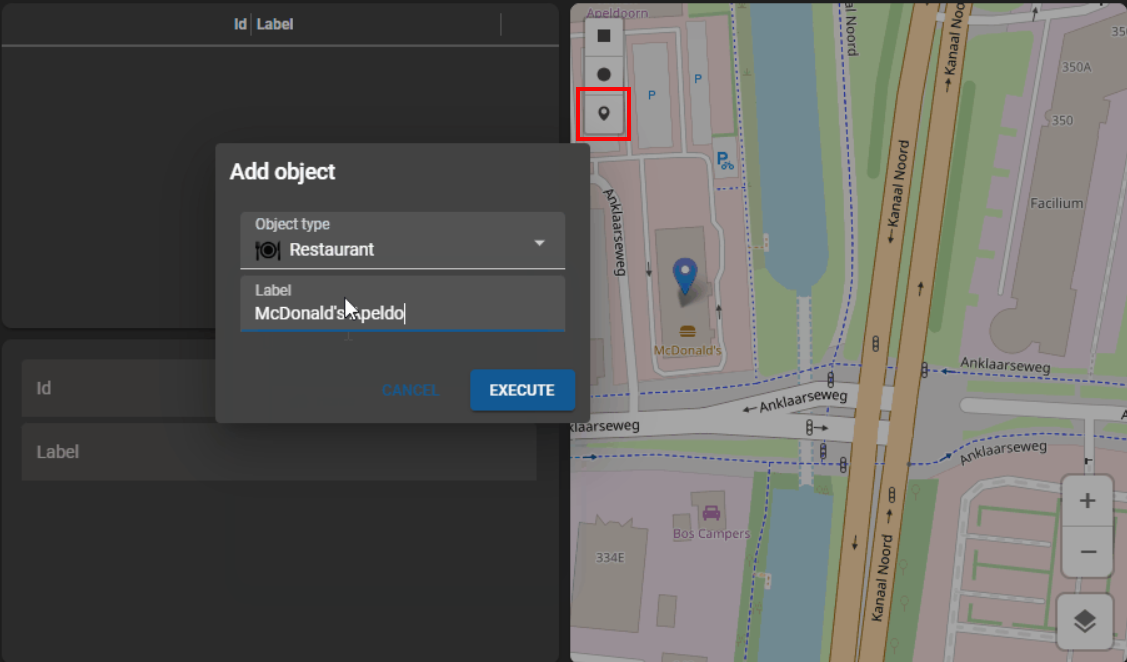 Example: a map with a task for adding a marker, with a pop-up for an object type and a label
Allow users to move location markers on a map
You can allow users to move a location marker for a predefined location on a map.
The following requirements must be met:
- The table linked to the map must have the data manipulation permission Update.
- The latitude/longitude column specified for the map must be editable.
- A role must be available with the permissions mentioned above on both the table and the latitude/longitude column.
To allow users to move a location marker for a predefined location on a map:
menu User Interface > Maps > tab Data mappings
- Select "Marker" as the Geometric type.
- Select the checkbox Allow drag/drop.
Location markers
Configure location markers for a map
To configure custom location markers for a map, you need an image combo domain control with elements. The element images are used as markers. You must define at least one element (marker). More elements are useful if you have different types of data within the entity, such as a route with a starting point and a destination. For every element, you can further specify the settings on the tab Data mappings.
Example of an image combo with location markers
This is an image combo domain control with three elements, each with a different marker image:
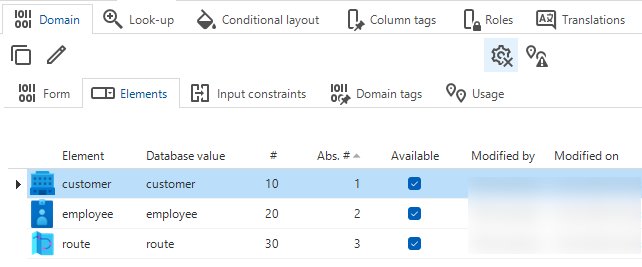 Example: an image combo domain control with markers as elements for a map
One of the markers is used in the map as follows:
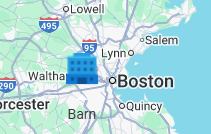 Example: a map with one of the markers from the image combo domain control
Make sure the database value of each element matches the element id. If not, navigating to different coordinates will malfunction and markers will not become visible.
To configure location markers for a map:
menu User Interface > Maps > tab Maps
- In the field Data mapping column, select an image combo domain control that contains the markers as elements.
Remove labels from location markers
By default, the label of a location marker is taken from the table's lookup display. To remove the label from a location marker:
menu User Interface > Maps > tab Maps
- Select the checkbox Custom label.
- Leave the field Label column empty.
Location coordinates
Format of location coordinates
The location coordinates with longitude and latitude must be specified in JSON format as follows:
{ "CoordSets": [ [ { "Lon": "5.9795099", "Lat": "52.2084904" } ] ] }
To display a line (used for routes) or polygon (used for areas), the JSON must contain multiple coordinates:
{ "CoordSets": [ [ { "Lon": "-76.499107", "Lat": "39.243073" }, { "Lon": "-76.499146", "Lat": "39.243053" } ] ] }
The coordinates are not automatically retrieved, so make sure you have a process to call a Geolocation web service. For example, Google, Here, OpenStreetMap, or Mapquest.
Set the radius of a circle marker
Universal GUIWhen displaying a marker of type Circle, you can set the radius of the circle as follows. The default value for radius is 200 meters.
{
    "CoordSets": [
        [
            {
               "Lon": "10.865400",
               "Lat": "55.565922"
            }
        ]
    ],
    "Radius": 120
}
Crossing the edge of a map
If you create a geometric type that crosses one of the edges of a map, the resulting route might not be displayed properly.
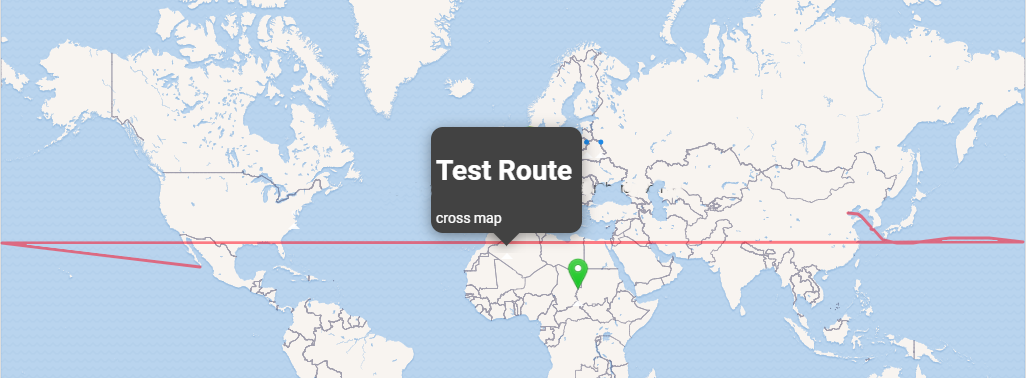 A route jumps from one edge of the map to the other
To better display such routes, the edges of the map are extended by 180 degrees. Adapt your coordinates accordingly to correct the way the route is displayed. The longitude degrees in the route data must be entirely positive or negative to keep the route together. For this purpose, they may go over the usual limit of -180 or 180 degrees.
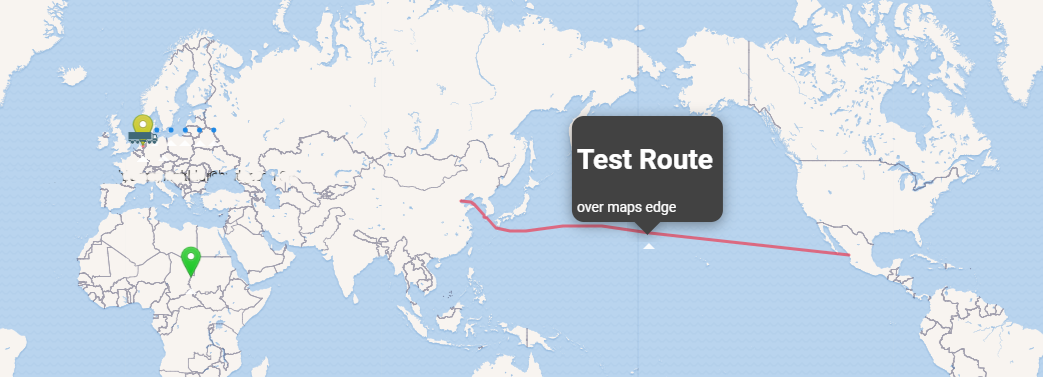 A route extends across the edge of the map
Troubleshooting Maps
If you are not seeing expected behavior (such as, nothing appears on the map), check the following:
- Base layer URI - Ensure that the base layer URI is correct and accessible. You can test the URI in a web browser to see if it returns the expected map tiles. See also Base layer settings.
- Overlay layer URI - Ensure that the overlay layer URI is correct and accessible. Similar to the base layer, you can test it in a web browser. See also Overlay settings.
- Data mapping - Ensure that the data mapping column is correctly configured and contains valid data. The data should match the expected format for the map markers or shapes. See also Data mappings.
- Location coordinates - Ensure that the location coordinates are in the correct format (JSON) and contain valid latitude and longitude values. See also Location coordinates.
- Tasks in a map - If you have allowed users to add markers or geometric shapes to the map, ensure that the table tasks are correctly set up and linked to the map. See also Allow users to add a marker or geometric shape to a map.
- Editable location marker in a map - If you have allowed users to move a location marker, ensure that the required permissions are set up correctly for the table, columns, and roles. See also Allow users to move location markers on a map.