Indicium troubleshooting
Introduction
This page provides information on how to troubleshoot Indicium. It describes common issues and how to resolve them. For more information about possible startup errors, see Startup errors in the Indicium setup guide.
Debug Center
The Debug Center is a powerful tool designed to help you monitor and troubleshoot your applications effectively. The Debug Center has the following features:
Requirements for the Debug Center
To access the Debug Center, you must meet the following requirements:
- You must have the Developer mode role assigned in IAM. For more information on the available options in Developer mode, see Introduction to developer mode.
- You must turn on the WebSocket Protocol feature of IIS.
-
To enable WebSockets in IIS in Windows Server 2019, configure
Server Manageras shown below.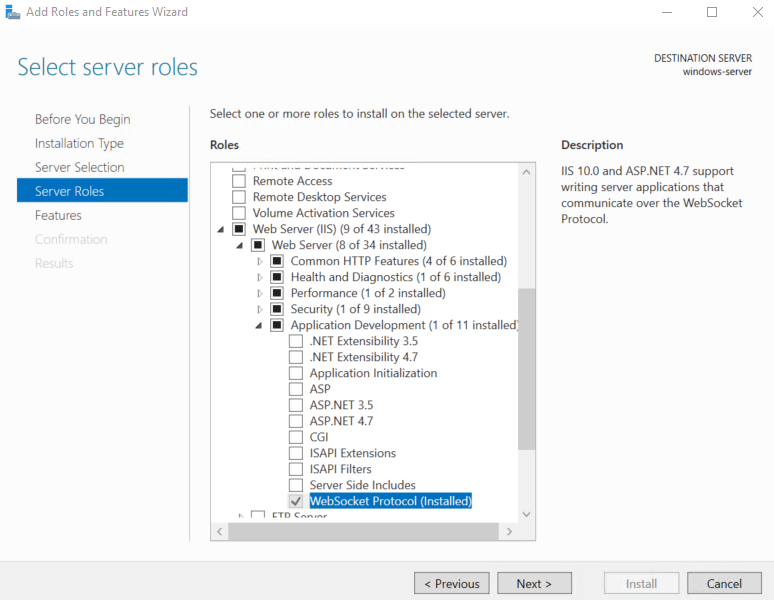 Enable WebSockets in Windows Server
 -
To enable WebSockets in IIS in Windows 11 and 10, configure
Windows Featureas shown below.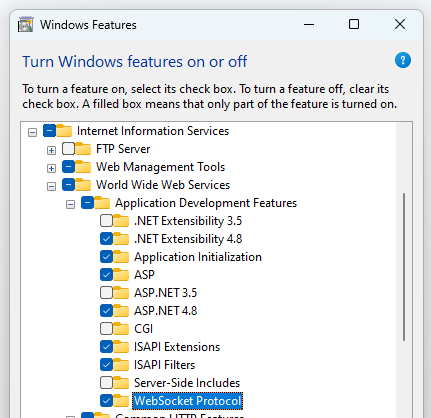 Enable WebSockets in Windows 11 and 10
 -
To enable WebSockets for Azure, see Enable WebSockets for Azure.
-
Open the Debug Center
To open the Debug Center:
- Universal GUI Go to the profile menu and select Debug Center.
- Windows 3-tier Go to the tab Developer > Debug > tab Debug Center.
- Directly via the Indicium URL (
indicium/debug-center).
Indicium log files
Indicium Universal GUI Windows 3-tierYou can access Indicium log files in two ways:
- Regular log files: Gather multiple log files from the web server Indicium is running on.
- Error log: Download the latest log file from the Error Log in the Debug Center.
The Error Log has the following advantages over the regular error log of Indicium:
- Text-based filtering
- Specific error level filtering (for example, info and warnings only)
- The request URL (RequestPath) that caused the error
- Sometimes, errors are caused by incorrect model settings. You can check this in the Software Factory: menu Quality > Validations.
- If the log files do not provide enough information, you can also check:
- The Windows Event Viewer (Windows Logs > Application).
- The Error Log in the Debug Center.
Error Log
You can access the Error Log in the Debug Center. The following options are available:
- Search - filter log entries by text.
- Log level - filter log entries by log level.
- Maximum items - change the number of log entries displayed.
- Pause log - stop the log from updating automatically.
- Clear - clear all log entries (locally). When you refresh the page, the log entries will reappear.
- Error Log - download the latest log file.
- If web sockets are enabled on the web server, the Error Log maintains an open connection with Indicium. New log entries are added automatically as they occur.
- If web sockets are not enabled, you must refresh the page to see the latest log entries.
- If Indicium is horizontally scaled, and Redis is configured for state management, the Error Log shows the log entries of all Indiciums simultaneously rather than just the Indicium to which you are connected.
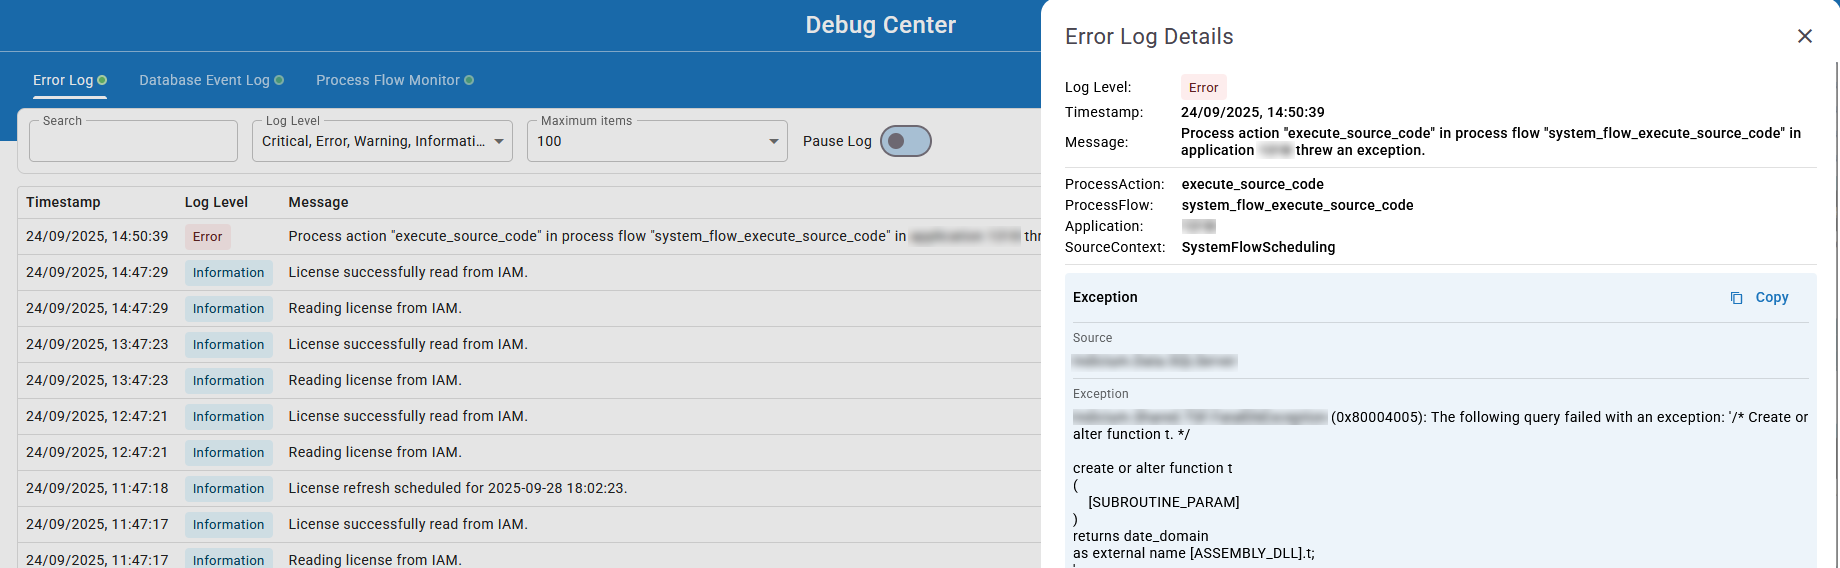 The 'Error Log' in the Debug Center
Regular log files
To collect multiple log files, you can go to the web server Indicium is running on. You must have access to this web server and to the Indicium deployment directory.
To gather multiple log files:
- Go to the web server where Indicium is running.
- Go to the the root of the Indicium deployment directory.
- Go to the Logs folder.
- Gather the relevant log files.
Database Event Log
Indicium Universal GUI Windows 3-tierYou can access the Database Event Log in the Debug Center. The Database Event Log shows the events that Indicium has recorded in the database. This log is useful for troubleshooting issues with database operations, such as query errors or query performance.
The following options are available:
- Search - filter log entries by text.
- Type - filter log entries by type.
- Maximum items - change the number of log entries displayed.
- Min duration - filter log entries by minimum duration.
- Pause log - stop the log from updating automatically.
- Clear - clear all log entries (locally). When you refresh the page, the log entries will reappear.
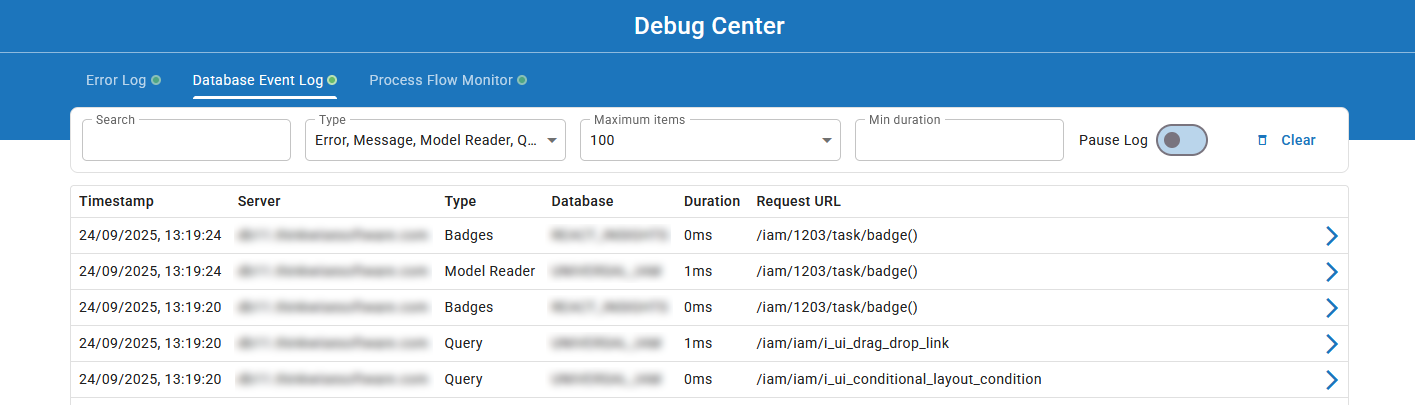 The 'Database Event Log' in the Debug Center
Process Flow Monitor
Indicium Universal GUI Windows 3-tierYou can monitor what happens during the execution of a process flow, useful for debugging and optimizing process flows. You can either start a process flow to monitor (begin at step 1), or monitor a process flow that is already running (skip to step 5).
To use the process flow monitor:
-
Open the Debug Center and go to the tab Process Flow Monitor.
-
Select a Meta source. The meta source specifies where the application model is located.
- sf - usually for development environments.
- iam - usually for production environments.
-
Select an Application ID or alias. See Application ID and Alias for more information.
-
Select Refresh model before testing a new or changed process flow.
-
Select the Process flow that you want to monitor from the dropdown menu.
-
Start the process flow you want to monitor (in the Universal GUI or through an HTTP client). Entries will appear in the process flow monitor, containing a timestamp, the name of the process flow, and the unique ID of the process flow instance.
-
Select an entry to expand it and view its details. Each entry contains all the recorded events for that process flow. You can expand an event to see further details of the event.
Included events are:
Event Description ProcessActionCompletedContains the state of the process variables after the process action has been completed, after the output parameters have been processed. It also contains the values of the output parameters, but only those that have been mapped to process variables. The status code of the process action is always shown as a standalone row in this overview. ProcessActionStartedContains the state of the process variables at the start of the process action. It also contains the values that the input parameters of the process action received. ProcessFlowAbortedContains the values of the process variables at the time the process flow was aborted. An error message is included. ProcessFlowCompletedContains the values of the process variables at the end of a process flow, after all process actions have been completed. ProcessFlowStartedContains the values of the process variables at the start of a process flow, before any process action has been started. ProcessProcedureCompletedContains the values of the process variables at the completion of a process procedure. ProcessProcedureStartedContains the values of the process variables at the start of a process procedure. The same events are available for the subflows of process actions:
ProcessProcedureSubFlowCompletedProcessProcedureSubFlowStartedSubFlowCompletedSubFlowProcessActionCompletedSubFlowProcessActionStartedSubFlowStarted
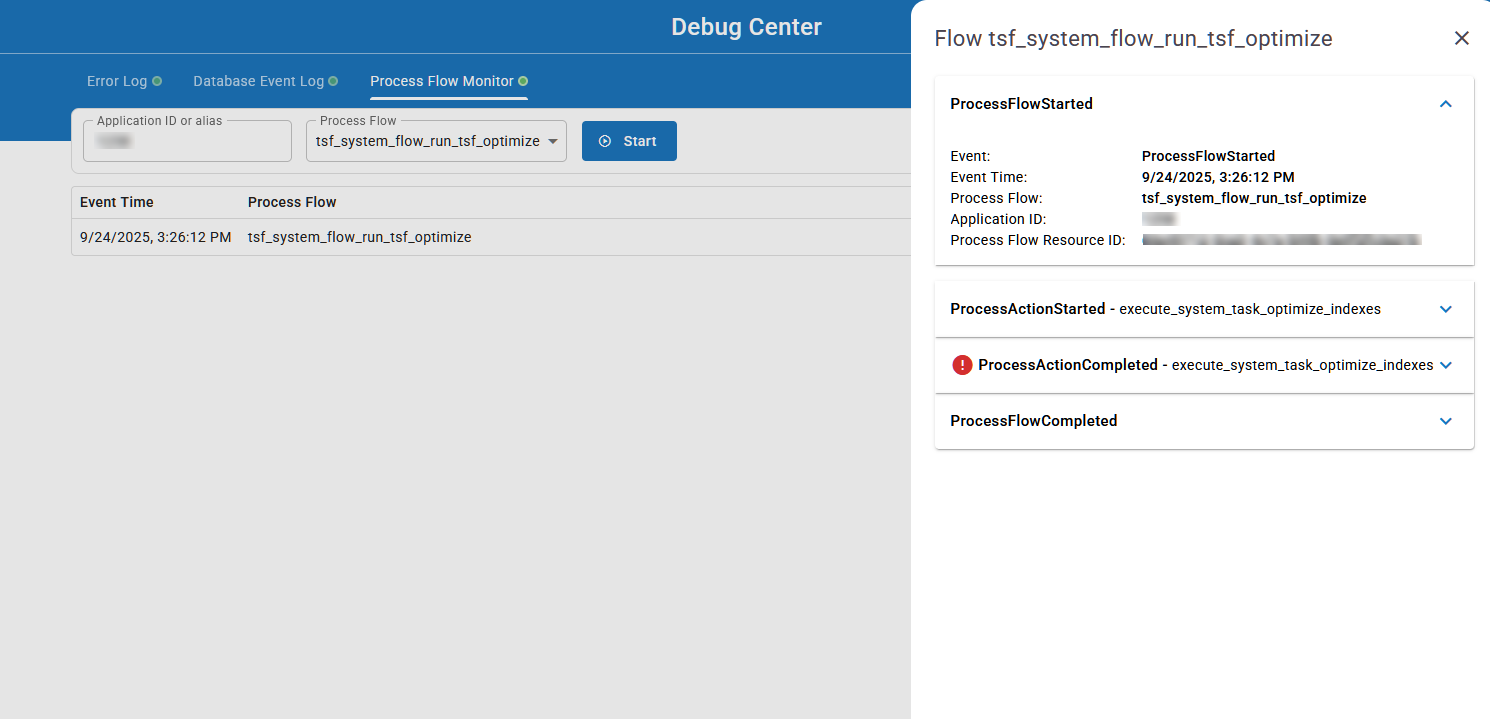 The 'Process Flow Monitor' in the Debug Center
Monitoring Indicium live
Indicium is capable of logging automatically to Azure Application Insights. This service can be used for monitoring Indicium live. You can, for example, inspect failed requests, monitor response times, or investigate exceptions.
Read the examples below to learn how Azure Application Insights can help you in the development process. Such logging capabilities are extremely useful, especially when you do not have direct access to Indicium's error logs. But even when you have direct access to the log files, the extra features offered by Azure Application Insights make it worth enabling.
Set up Azure Application Insights
This feature is enabled by default, but to use it, you need a paid Azure account with Application Insights enabled as a resource.
The next step is to find your Application Insights Instrumentation key and add it to Indicium's appsettings.json file.
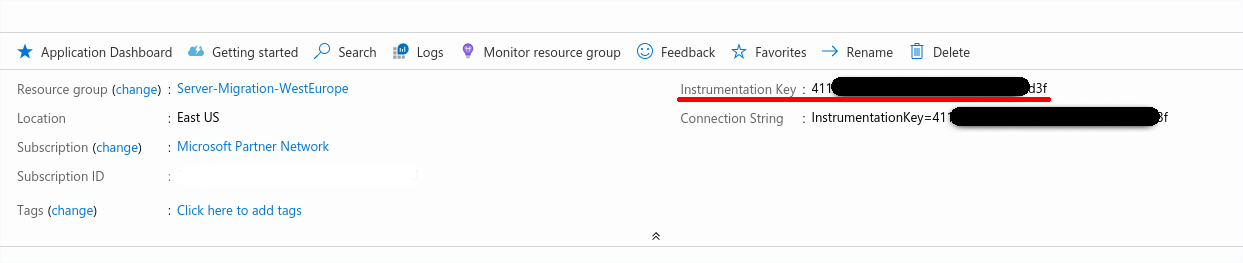 Azure Application Insights instrumentation key
{
  "ApplicationInsights": {
    "InstrumentationKey": "actualinstrumentationkey"
  }
}
Controlling the logging levels
Similar to the standard logging, you can control the logging levels by adding the following to the appsettings.json file:
{
  "Logging": {
    "ApplicationInsights": {
      "LogLevel": {
        "Default": "Information",
        "System": "Information",
        "Microsoft": "Warning",
        "Indicium": "Debug"
      }
    }
  }
}
More information about the different logging levels can be found here.
Viewing SQL commands in Application Insights
It is possible to view SQL commands in Application Insights.
To enable the logging of SQL commands, add the following to the appsettings.json file:
{
  "Telemetry": {
    "EnableSqlCommandTextLogging": true
  }
}
After configuring Indicium, SQL commands will be visible in Application Insights.
Analyze login events
To analyze failed and successful login events in Azure Application Insights:
- Go to the menu Monitoring > Logs.
- Run the following query:
traces | where customDimensions ["ProviderName"] == "Thinkwise-Login"
-
Inspect the events:
- Analyze the individual data in the tab Results:
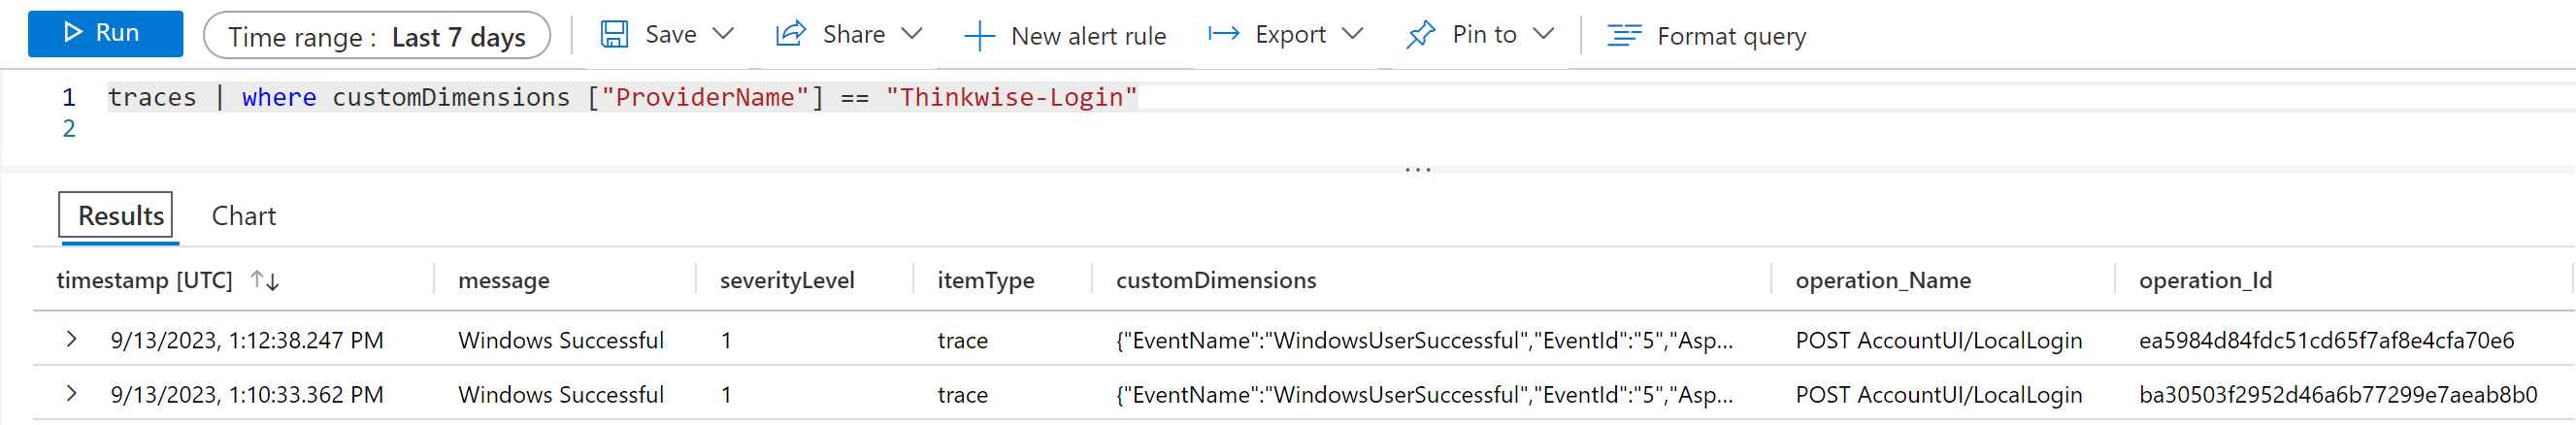 The query and its results
- Analyze the accumulated data in the tab Chart:
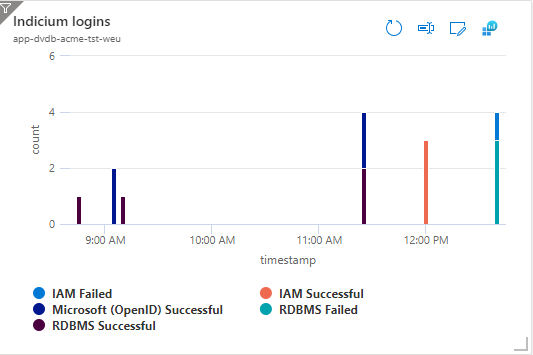 A chart with the accumulated login results
Analyze failed requests
This topic shows an example of how to inspect failed requests in Azure Application Insights:
- Go to your Azure Application Insights resource. The first screen is the overview. It features several graphs about your application's performance.
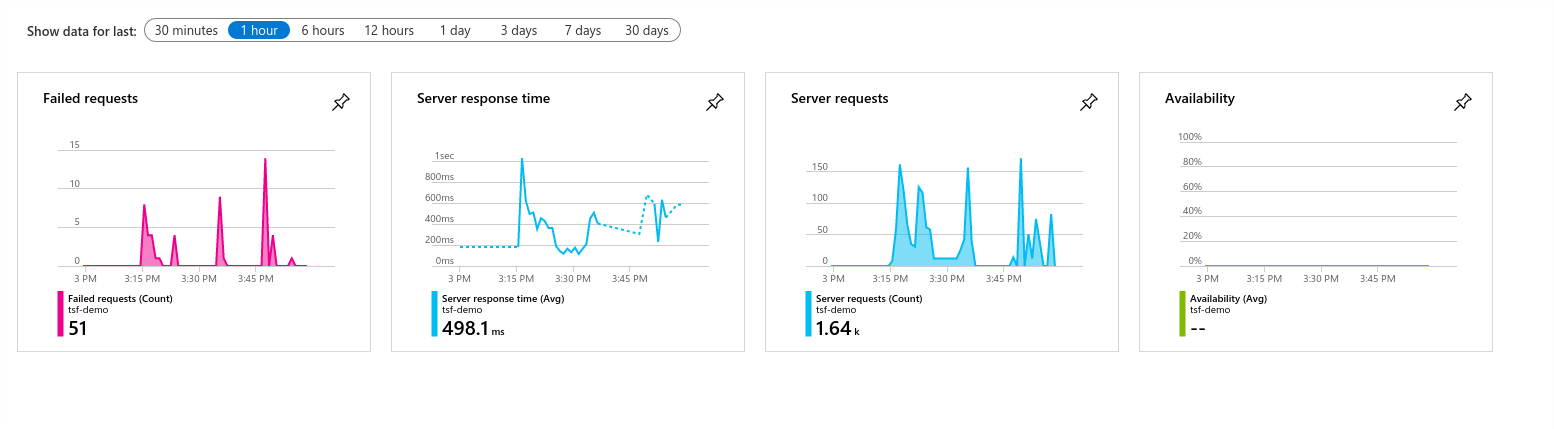 Azure Application Insights overview
To investigate failed requests:
- Click on the Failed Requests graph.
An overview opens of all failed requests within a specific time interval, the last 30 minutes in this example.
The request with the highest number of failures seems to be a GET request for a badge on generate_sales_invoice.
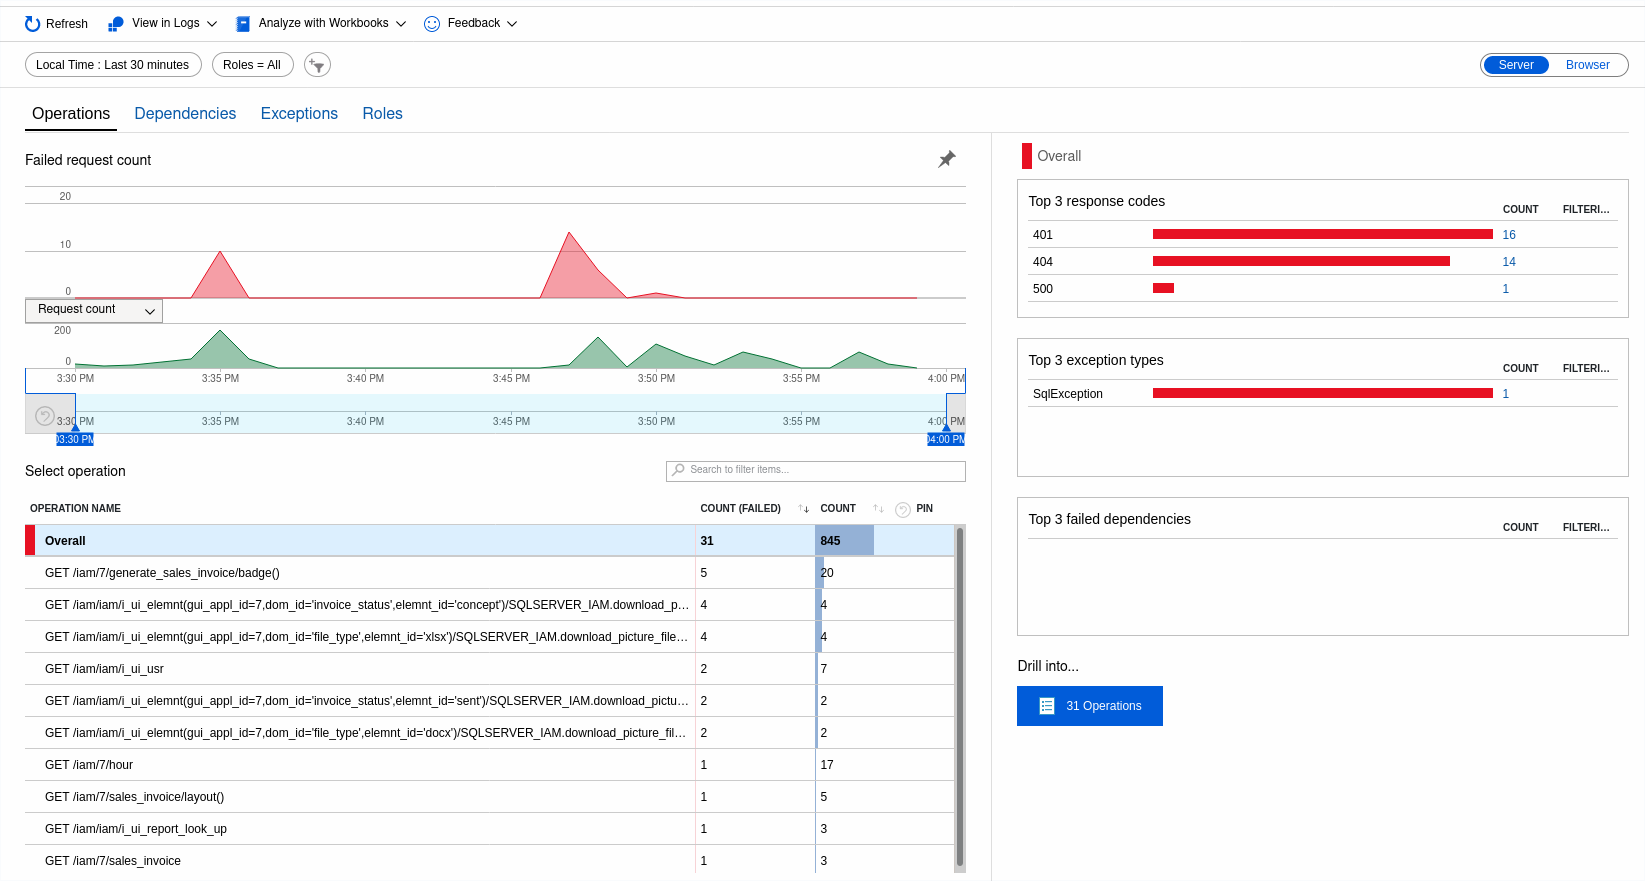 Azure Application Insights failed requests
- Click on the request to get more detailed information. In this case, Indicium is returning a
401 Unauthorizedresponse code for this resource.
![]() Azure Application Insights badge request
Azure Application Insights badge request
Something else that might be worth investigating is the logged SqlException.
- Go to the Exception tab and click on the exception message on the right of your screen. The following screen gives highly detailed information about this exception.
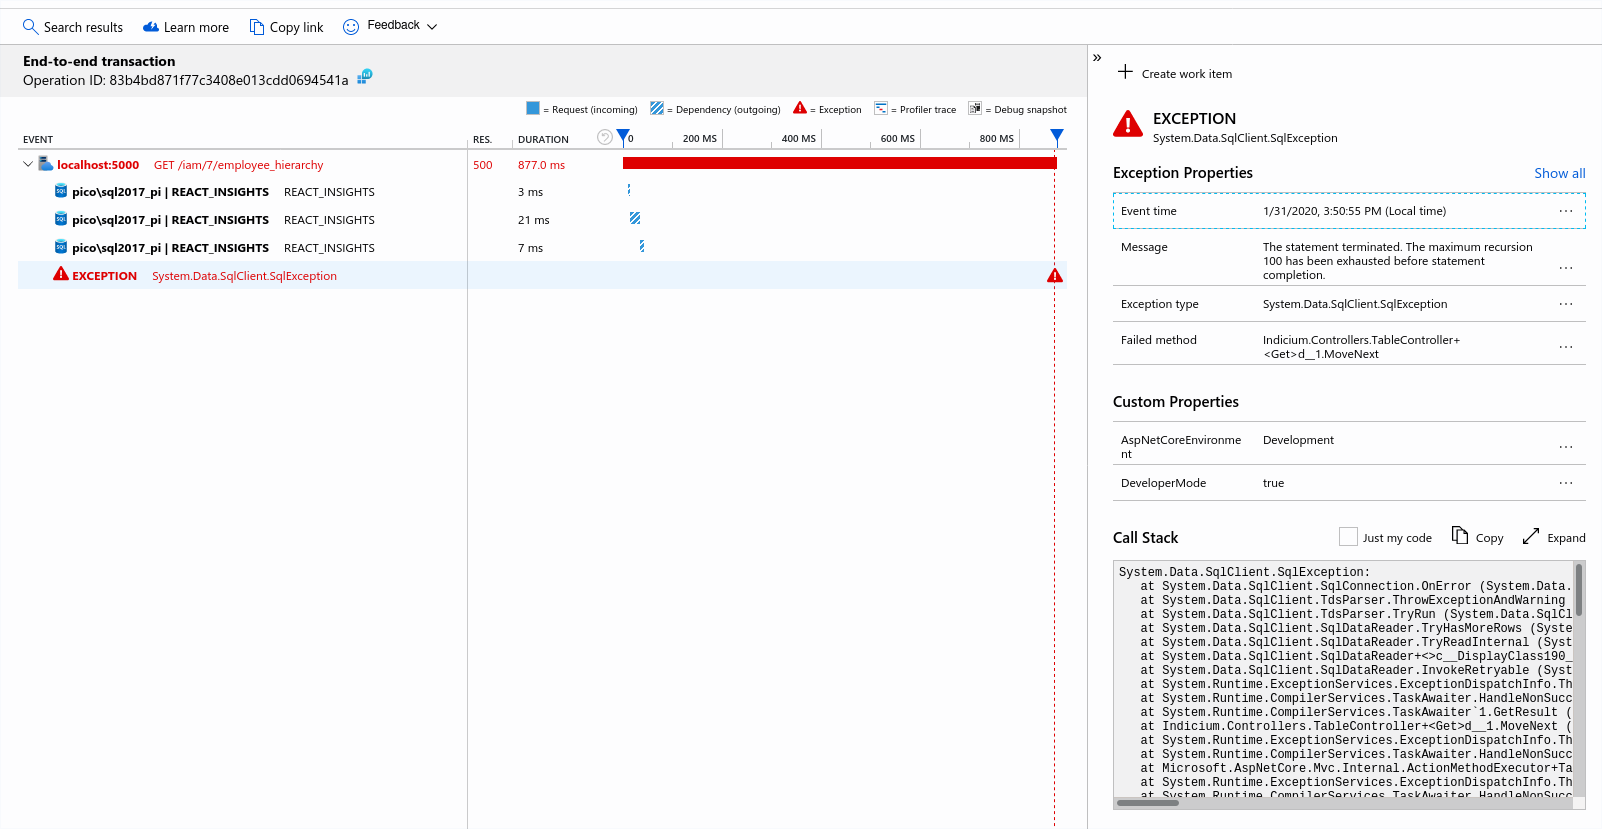 Azure Application Insights exception
This screen shows one of the advantages of debugging with Application Insights. Not only is the SQLException shown with a full stack trace, but it also gives an overview of what led to the actual exception over time.
In this example, the exception is preceded by a GET request on the employee_hierarchy resource.
Apparently, while processing the request, some piece of SQL code is giving a maximum recursion error.
With this information, you now know that there must be a problem in a SQL template, and that the problem is caused by the employee_hierarchy view.
This view uses a recursive common table expression (CTE) that seems to end in an infinite loop.
Measure Server-Timing responses
IndiciumYou can view several performance metrics for requests using Server-Timing response headers. Browser developer tools can interpret these headers and visualize the performance. Performance metrics can provide a detailed insight and help solve potential performance issues, often caused by specific queries, layout procedures, or file storage operations.
Each measurement gets its own Server-Timing header. That way, you can easily distinguish between different reasons for performance issues. For example, a request might take a long time because one operation that performs poorly slows it down. It might also take longer because one of its operations is performed multiple times.
The available performance metrics are:
CRUD operations
- All SELECT queries for requested subjects of an application (tables and views).
- When the $count operation requests the total number of records, this will be measured and returned separately.
- When the $expand operation joins a lookup or a detail subject, these will each be measured and returned separately.
- Insert statements.
- Update statements.
- Delete statements.
- Expression queries while adding or editing a record.
- Default value queries when entering edit mode to add a new record or start a task or report.
- Lookup validations when changing a lookup value or a lookup filter value.
Application logic
- Tasks.
- Subroutines.
- Default procedures.
- Layout procedures.
- Context procedures.
- Badge procedures.
- Change detection procedures (the new logic concept).
File storage
- Fetching the database record for a file to be downloaded.
- Calculating the hash of a file.
- File access (this can be considered as obtaining a file connection, but does not include the entire download process).
- Writing files (this does include the entire upload process).
Miscellaneous
- Fetching records by primary key. This is, for instance, done when starting a task in the context of a record. This record will first need to be fetched.
- Loading the application model. After restarting Indicium or changing the application model, the model needs to be loaded, which may take multiple seconds on top of the request performed.
Performance metrics are listed under Server timings in your browser's developer tools. Some examples:


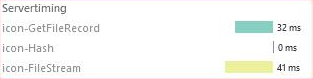 Examples of Server-Timing metrics
Running Indicium in Development mode
As convenient as it may seem to always run all instances of Indicium in Development mode, do not do this. Only run Indicium in Development mode when you are actually developing and debugging problems or if Indicium is only accessible by trustworthy users.
By default, Indicium runs in Production mode. In this mode, Indicium limits the amount of information it sends to clients when database errors occur for security reasons. Indicium in Production mode will send the translatable database errors, such as primary key violations, to the client.
Production mode does not influence the amount of information that is logged to disk when errors occur. Indicium will always log all errors, whether related to the database or not, to the Logs folder in the root of Indicium.
If you want to run Indicium in Development mode, you need to set the Development environment variable in the Web.config file in the root of Indicium:
<configuration>
    <system.webServer>
        <handlers>
            <add name="aspNetCore" path="*" verb="*" modules="AspNetCoreModuleV2" resourceType="Unspecified"/>
        </handlers>

        <!-- Set Development environment variable -->
        <aspNetCore processPath="%LAUNCHER_PATH%" arguments="%LAUNCHER_ARGS%" stdoutLogEnabled="false" stdoutLogFile=".\logs\stdout" forwardWindowsAuthToken="false">
            <environmentVariables>
                <environmentVariable name="ASPNETCORE_ENVIRONMENT" value="Development" />
            </environmentVariables>
        </aspNetCore>

        ...

    </system.webServer>
</configuration>
Troubleshooting possible login issues
Login failed
Full message: "Login failed. Please contact your system administrator".
The credentials are correct but the corresponding user in IAM is probably configured wrongly:
- Check if IAM contains a user entry corresponding to the user's email (menu Authorization > Users).
- Check in IAM if the corresponding user is configured with the External authentication type (menu Authorization > Users > tab Form > tab User > field Authentication type).
401 - Unauthorized
When a user gets "401 - Unauthorized" results, the browser keeps prompting to log in. If you are certain that the specified credentials are correct, check if the user's authentication method is set correctly.
404 - Application not found
If an application URL (e.g. https://server/indicium/iam/myAppl/) gives the result "404 - Application not found",
and you are certain that the URL is correct, ensure that the user that you are using to log in has access to the application in IAM.
When accessing an application present in the Software Factory (e.g. https://server/indicium/sf/myAppl/),
ensure the user logged on to Indicium has this application activated.
Error: 'i_ui_global_settings failed to load'
The global settings, which includes license information, session settings, and so forth, cannot be loaded.
- Check the internet connection or the connection to the IAM server. It could be that the IAM server is temporarily unavailable, or that there is a network issue.
- Log in again after a few minutes. If this does not work, then select Clear cache on the login screen and try again.
Error: 'could not reach meta URL'
Indicium cannot retrieve the application model using the meta URL (Meta Source).
The Metasource is configured by the user in the address bar,
or set up in the config.json file of the Universal UI.
- Reconfigure the metasource to point to the correct URL. If this is not possible, contact the main administrator of the application.
Error: 'This platform isn't available for the application'
The application does not exist. This error occurs if a non-existing application ID or alias is used.
- Choose a different application.
- Clear the application id or alias from the URL and try again. If this does not work, contact the main administrator of the application.
Stuck on Indicium logout page
When Indicium is running on a domain other than the Universal GUI (not recommended for production environments), users might get stuck on the Indicium logout page after logging out.
To work around this, add the Universal GUI URL to the whitelist of allowed URLs that Indicium can use to redirect users when needed:
- Log in to IAM.
- Go to menu Settings > Global settings > tab Client redirect.
- Enter the URL of the Universal GUI.
See also Client redirect in the IAM manual.