Logs and analysis
Introduction to logs and analysis
main administratormenu Analysis
In menu Analysis, the following items are available:
- Security checks - check if end users only have access to the data they are allowed to see. See Security checks.
- Session log - an overview of all sessions for all users. See Session log.
- Slow query log - overview of underperforming queries. See Slow query log.
- Session analysis - a pivot table to analyze all user sessions. See Session analysis.
- Two-factor log - an overview of the use of two-factor authentication for all users. See Two-factor log.
- Action analysis - a pivot table to analyze all actions.
- Recommendations - user preference suggestions based on the user logs. See Analyze user behavior and apply recommendations.
- Scheduled system flows - to check the status of the scheduled system flows for your applications. see System flows.
- Notifications - push notifications to users. See User notifications.
More logs are available in the menu Applications > Environment monitoring. For more information, see Environment interaction logs.
Slow query log
Performance issues that are not detected during development may arise in a production environment. This is often due to larger datasets or more active users when the application is live. The slow query log identifies underperforming queries, depending on the Query threshold. It logs the following information:
- Date time (UTC) of execution
- Application alias
- Database
- Object
- Server name
- Duration (ms) of execution
- Dismissed (yes/no)
- Reason for dismissal (if applicable)
Slow query log data is stored in the IAM database. To keep the log size manageable, only the first 500 bytes/characters of blob and CLOB values are logged. The retention period for slow query log data is controlled by the Application log retention setting. For more information, see Application log retention.
To open the slow query log:
menu Analysis > Slow query log
or
menu Applications > Environment monitoring > Slow query log
In this screen, you can:
-
Filter queries using Search.
-
View logs older than 7 days by deselecting the prefilter Past week.
-
Dismiss queries by executing the task Dismiss query
 .
When you dismiss a query, you can choose to:
.
When you dismiss a query, you can choose to:- Set a custom threshold - Enter a Custom threshold (ms) for the query. When a future instance of the query falls below the custom threshold, it is automatically dismissed.
- All instances - Dismiss all current and future instances of the query.
- This instance - Dismiss only the instance of the query.
- Dismissal reason - Optional. Enter a reason for dismissing the query. Dismissed queries are added to the table Dismissed query objects.
tipYou can adjust the default Query threshold in the menu Settings > Global settings > tab Form > group Logging.
- The default is 200 ms.
- Do not set the Query threshold too low, as this can impact performance and cause the log to grow excessively.
- Set Query threshold (ms) to
0to disable the Slow query log entirely.
-
Universal Copy the query text by selecting Copy to clipboard.
-
View dismissed queries by deselecting the prefilter Hide dismissed queries or viewing the table Dismissed query objects.
-
Remove or edit dismissed queries from the table Dismissed query objects by using the CRUD buttons.
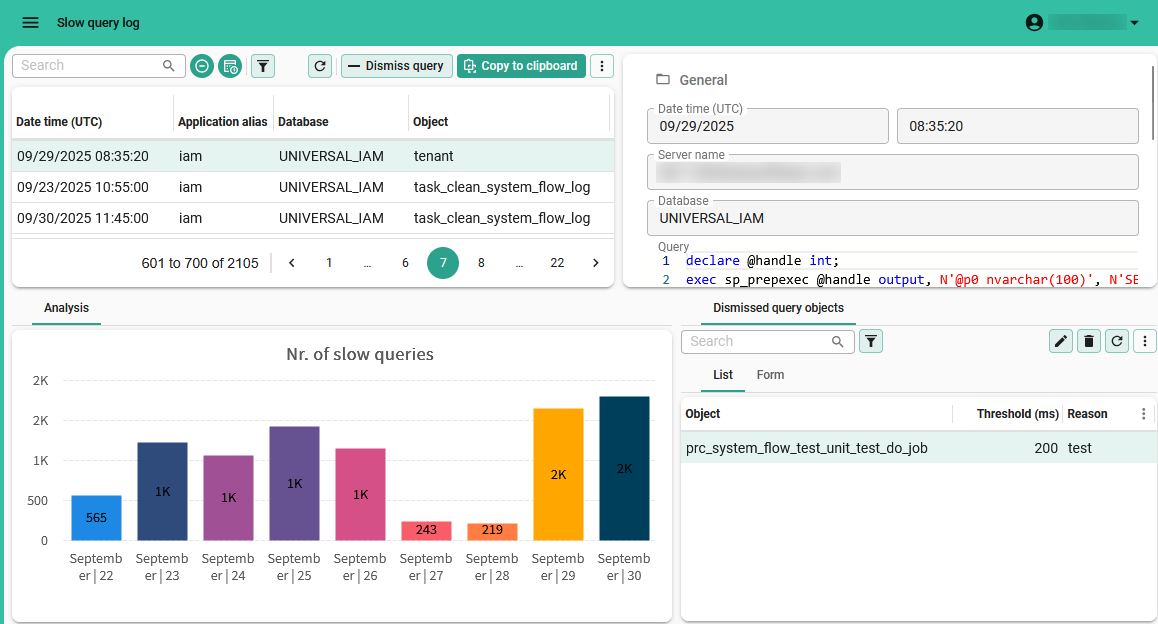 Use the slow query log to identify underperforming queries